
Primary and acquired resistance to first-line therapy for clear cell renal cell carcinoma

Abstract
The introduction of first-line combinations had improved the outcomes for metastatic renal cell carcinoma (mRCC) compared to sunitinib. However, some patients either have inherent resistance or develop resistance as a result of the treatment. Depending on the kind of therapy employed, many factors underlie resistance to systemic therapy. Angiogenesis and the tumor immune microenvironment (TIME), nevertheless, are inextricably linked. Although angiogenesis and the manipulation of the tumor microenvironment are linked to hypoxia, which emerges as a hallmark of renal cell carcinoma (RCC) pathogenesis, it is only one of the potential elements involved in the distinctive intra- and inter-tumor heterogeneity of RCC that is still dynamic. We may be able to more correctly predict therapy response and comprehend the mechanisms underlying primary or acquired resistance by integrating tumor genetic and immunological markers. In order to provide tools for patient selection and to generate hypotheses for the development of new strategies to overcome resistance, we reviewed the most recent research on the mechanisms of primary and acquired resistance to immune checkpoint inhibitors (ICIs) and tyrosine kinase inhibitors (TKIs) that target the vascular endothelial growth factor receptor (VEGFR).We can choose patients’ treatments and cancer preventive strategies using an evolutionary approach thanks to the few evolutionary trajectories that characterize ccRCC.

Keywords
INTRODUCTION
The recent approval of the new first-line combinations, which include immune checkpoint inhibitors (ICIs) both plus VEGFR-TKIs or the anti-cytotoxic T lymphocyte antigen-4 (CTLA-4) monoclonal antibody (mAb), ipilimumab, has revolutionized the treatment of metastatic renal cell carcinoma, reporting improved outcomes in pivotal studies[1-7]. Despite the excellent response rates, some patients are either innately resistant to therapy or eventually develop later resistance to it. Hence, a better understanding of the mechanisms underlying VEGFR-TKI and/or ICI resistance will be helpful in selecting patients who might not respond to this kind of approach and developing strategies to overcome resistance.
Today, the only validated risk assessment tool is risk stratification according to the International mRCC Database Consortium (IMDC) score, which is based upon six clinical and laboratory features[8,9]. However, this approach lacks the ability to recognize genetic and intrinsic factors that potentially direct response to immunotherapy and has only been thoroughly validated for patients treated with single agent VEGFR-targeted therapies.
Here, we reviewed the most recent research on the factors that contribute to both primary and acquired resistance to VEGF-TKI and ICI with the aim of supplying tools for patient selection and generating hypotheses in an effort to decrease the proportion of patients who do not respond or to postpone the emergence of resistance.
MOLECULAR SUBSETS IN METASTATIC RENAL CELL CARCINOMA
Clear cell renal cell carcinoma (ccRCC) is a highly inflamed and immune-infiltrated tumor type with high expression of immune checkpoints, such as PD-L1 and CTLA-4. However, ccRCC has the peculiarity of having a high degree of infiltration by exhausted CD8+ tumor-infiltrating lymphocytes (TILs), immunosuppressive cells such as M2-like tumor-associated macrophages (TAMs), regulatory T cells (Tregs), and myeloid-derived suppressor cells (MDSCs), which characterized a tumor microenvironment with immunosuppressive properties[10-12].
Immune cells (IC) are components of tumor immune microenvironment (TIME) and play an important role in modulating immune response to tumor cells[13]. These cells could have been implicated both in immune tumor suppression and tumor escape.
More than just identifying individual cells, the microenvironment’s composition could provide insight into the mechanisms causing immune escape, and choosing more effective targets could lead to better results. Using ccRCC samples, Chevrier et al. examined the TIME’s composition and discovered a particular exhausted CD8+/PD-1+ T cell phenotype that was defined by the co-expression of inhibitory receptors and might be the cause of immune suppression. Additionally, they discovered CD38 to be a marker of exhaustion in the CD8+/PD-1+ T cell phenotype, and these cells were closely associated with the presence of regulatory CD4+ T cells and of a cluster of macrophages with the highest expression of CD38 and immune suppressive activity.
Rather than focusing on each cell individually, TIME composition and the number of immune cells may be able to predict outcomes more accurately[14].
Additionally, the TIME could be altered by the use of VEGFR-TKIs and ICIs[15-21], and the TIME may also be impacted by genetic changes in ccRCC, such as von Hippel-Lindau (VHL) and PBRM1mutations. As a result, different genomic signatures may confer a different response to a specific treatment. Therefore, a deeper comprehension of the molecular traits that uniquely distinguish ccRCC is required to enhance patient selection, risk stratification, and resistance mechanism definition.
Three major gene expression signatures have been identified using data from the first-line pivotal trial in mRCC (IMmotion 150, JAVELIN RENAL 101, Checkmate 214): Angiogenesis, T-effector (Teff)/IFN-γ response, and myeloid inflammatory gene expression signatures[22-24].
Gene expression patterns that had been previously described in relation to their corresponding biology were used for the definition of gene signatures. Angio: VEGFA, KDR, ESM1, PECAM1, ANGPTL4, and CD34; Teff: CD8A, EOMES, PRF1, IFNG, and CD274; myeloid inflammation: IL-6, CXCL1, CXCL2, CXCL3, CXCL8, and PTGS2[25-27].
Angio gene profile identified a group of patients who would respond to a VEGFR-TKI alone, resulting in superior outcomes with sunitinib in each study. Given that a high T effector gene signature may indicate an improved response to a VEGFR-TKI and ICI combination therapy, the presence of a myeloid signature in the T effector high group identified tumors that are resistant to immunotherapy when used alone, as demonstrated by the worse outcomes for patients treated with atezolizumab alone in the IMmotion 150 trial. Furthermore, a myeloid infiltrate, which is indicative of innate resistance to immunotherapy alone, could be overcome by the addition of a therapy targeting angiogenesis. Gene signatures based on a single class of genes may be effective tools that support patient selection. However, when using two immune checkpoint inhibitors, a combination of gene signatures including both innate and adaptative immune response components may be more suggestive of how TIME and therapies interact and may be more predictive of results. The “Renal 101 Immune signature”, a 26-gene subset of the gene expression signature (GES) that included regulators of innate and adaptive immunological responses (T cell and NK cell), cell trafficking, and inflammation, identified in JAVELIN RENAL 101, is an even more comprehensive molecular predictive tool, underlying the significance of CD8+ T cells in inducing immune response[23].
Table 1 schematically summarizes the correlation of GES (Angio, Teff, Myeloid) with positive outcomes in IMmotion 150, Javelin RENAL 101, and Checkmate 214.
Correlation between GES with favorable outcomes
MOLECULAR SUBSETS IN RCC AS BIOMARKER STRATEGIES FOR PERSONALIZED TREATMENT
In 2020, McDermott et al. completed a significant research effort to evaluate the outcomes of patients who received a combination of checkpoint inhibitors, applying the previously developed IMmotion 150 signatures to the IMmotion 151 trial[22]. In order to develop a new molecular categorization of RCC, they performed an integrative multi-omics analysis of 823 RCC tumors[28,29].
Non-negative matrix factorization (NMF) was used to identify seven distinct molecular clusters, and the distribution of these clusters across IMDC risk groups was assessed. They examined the somatic alterations within each cluster and investigated the clinical outcomes of patients who received atezolizumab in combination with bevacizumab, sunitinib, and atezolizumab across clusters.
Table 2 synthetizes cluster characteristics, gene profile expression, and their correlation with outcomes.
Molecular clusters by NMF, gene expression profiles, DNA alterations, and correlation with outcomes
| Cluster 1 | Cluster 2 | Cluster 3 | Cluster 4 | Cluster 5 | Cluster 6 | Cluster 7 | ||||||||
| Name | Angiogenic/ Stromal | Angiogenic | Complement/ -Oxidation | Teff/ Proliferative | Proliferative | Stromal/ Proliferative | snoRNA | |||||||
| Transcriptional Pathways | Angiogenesis Stroma | Angiogenesis Catabolic metabolism (FAO) | Complement cascade -oxidation | Cell-cycle Teff Anabolic metabolism (FAS) | Cell-cycle Anabolic metabolism (FAS) Myeloid inflammation | Cell-cycle Stroma | snoRNAs | |||||||
| Gene expression module | TGF, WNT, Hedgehog, NOTCH Stroma-genes: Fibroblast-derived genes FAP, FN1, PSTN, MMP2 | TGF, WNT, Hedgehog, NOTCH Catabolic mb: FAO/AMPK genes Moderate expression: Teff genes | Complement cascade Cytochrome P450 family Moderate expression: Cell-cycle genes | Cell-cycle Anabolic mb FAS Pentose phosphate Teff JAK/STAT IFN-α and -γ | Cell-cycle Anabolic mb Myeloid inflammation genes | Cell-cycle Anabolic mb Stroma-genes EMT transcriptional Myeloid inflammation genes | C/D box snoRNAs (SNORDs) | |||||||
| DNA alterations | PBRM1 VHL KDM5C PTEN | VHL PBRM1 KDM5C | VHL PBRM1 KDM5C PTEN BAP1 | VHL CDKN2A/B BAP1 | CDKN2A/B TP53 TFE fusions (mTORC1 pathway) | VHL CDKN2A/B TP53 | VHL SETD2 PTEN | |||||||
| PFS Months HR (95%CI) | Ate/bev | Sun | Ate/bev | Sun | Ate/bev | Sun | Ate/bev | Sun | Ate/bev | Sun | Ate/bev | Sun | Ate/bev | Sun |
| 15.3 | 13.9 | 13.8 | 14.2 | 8.1 | 7.1 | 10.9 | 6.1 | 8.3 | 4.3 | 6.8 | 5.2 | NR | 7.4 | |
| HR 1.11 (0.65-1.88) P = 0.708 | HR 1.16 (0.82-1.63) P = 0.397 | HR 0.92 (0.63-1.34) P = 0.666 | HR 0.52 (0.33-0.82) P = 0.005 | HR 0.47 (0.27-0.82) P = 0.007 | HR 0.81 (0.52-1.25) P = 0.331 | HR 0.10 (0.01-0.77) P = 0.028 | ||||||||
| OS Months HR (95%CI) | Ate/bev | Sun | Ate/bev | Sun | Ate/bev | Sun | Ate/bev | Sun | Ate/bev | Sun | Ate/bev | Sun | Ate/bev | Sun |
| NR | 48.2 | 46.2 | NR | 35 | 36.6 | 38.7 | 23.3 | 21.7 | 15.5 | 15.9 | 12.7 | NR | NR | |
| HR 0.94 (0.52-1.72) | HR 1.32 (0.91-1.91) | HR 0.99 (0.64-1.54) | HR 0.66 (0.41-1.06) | HR 0.66 (0.39-1.12) | HR 0.90 (0.57-1.40) | HR NC | ||||||||
Angiogenic clusters (1 and 2) were enriched in the favorable risk group (evaluated both according to MSKCC and IMDC risk categories) and showed better progressive-free survival (PFS). However, angiogenic signature did not differentiate outcomes between arms. No correlation was also seen for patients belonging to cluster 3 (complement/-oxidation).
Otherwise, the poor-risk group was more likely to have proliferative clusters (4-6), with stromal/proliferative clusters demonstrating the shorter PFS irrespective of treatment arm. Teff/proliferative and proliferative cluster results, as well as the snoRNAs cluster, experienced better outcomes with the atezolizumab plus bevacizumab combination.
Among somatic alterations, PBRM1 mutations gave superior results, irrespective of the treatment arm. But in PBRM1 mutant patients, Atezolizumab + Bevacizumab showed improved PFS and ORR than sunitinib. Conversely, CDKN2A/B alterations identified patients with worse prognoses. However, CDKN2A/A-alterated tumors had better PFS and ORR in the atezolizumab + bevacizumab arm compared with the sunitinib arm.
Better outcomes with the combination were also seen for tumors harboring loss-of-function mutations of ARID1A and/or KMT2C[28].
In conclusion, these molecular subsets constitute a novel method of reproducible response prediction that may be useful in patient selection. As shown for clusters 1 and 2, the angiogenesis pathway confers a biological behavior that is comparable for tumors treated with a VEGFR-TKI alone or in combination. A proliferative pattern, on the other hand, suggests a lack of response to a therapy that targets angiogenesis alone and a potentially better response to a combination therapy that includes ICIs. This classification does not include the combination of dual checkpoint inhibitors, which would restrict its reproducibility. However, we are aware that nivolumab + ipilimumab has shown superior outcomes in the category of intermediate-poor risk.
The tumors from patients with favorable risk in this study exhibited a higher expression of the VEGF pathway-associated angiogenesis signature, which provides a potential explanation for why the dual combination failed to improve outcomes in the favorable risk subgroup.
MECHANISMS OF PRIMARY RESISTANCE TO TYROSINE KINASE INHIBITOR IN RENAL CELL CARCINOMA
Primary resistance is characterized as a lack of response to therapy, which may be caused by the absence of a particular target’s expression or by the existence of inherently resistant clones that do not respond to target therapy. Furthermore, primary resistance may be influenced by spatial and temporal heterogeneity[30,31].
Primary resistance to VEGF-TKIs
Hypoxia and von hippel lindau pathway
The tumor suppressor protein von Hippel Lindau (VHL) is frequently mutated in hereditary RCC. VHL is a target of hypoxia-inducible factors (HIFs), dimeric proteins composed of O2-sensitive subunits (HIF-1, -2 or 3) and a subunit (HIF-2). In the presence of oxygen, these factors facilitated its degradation. VHL inactivation creates a pseudo-hypoxic state and HIF dimers can bind to hypoxia response elements (HREs) to induce angiogenesis and cancer cell proliferation. VHL disease is characterized by a decreased expression of HIF-1 and an increased expression of HIF-2, the latter connected with c-Myc activity[32].
Gordan et al. analyzed 160 tumor samples and found that VHL-deficient ccRCCs can be distinguished based on HIF- expression. Three different subgroups have been defined: (1) Wild-type VHL tumors with no HIF- expression; (2) VHL deficient tumors with HIF-1 and-2 expression; and (3) VHL deficient tumors with only HIF-2. The third subgroup (HIF-2 expression) displayed enhanced c-Myc activity and higher rates of proliferation. The authors also demonstrated an interplay between HIF-2, c-Myc and genome instability. Indeed, the VHL-deficient subgroup expressing HIF-2 was even characterized by an upregulation of the homologous recombination (HR) effectors BRCA1 and BARD1, and consequentially, HIF-2 tumors and no HIF-1 ones had a greater ability to repair DNA damage accumulation induced by replication stress[32,33].
Given that VHL-deficient tumors with only HIF-2 expression experienced primary resistance to angiogenesis inhibition, thus HIF-2a alone may identify a subset of RCCs in which targeted therapies lack efficacy.
Membrane transporters and lysosomal sequestration
The uptake and efflux of several TKIs (e.g., sunitinib, cabozantinib, pazopanib) could be mediated by multidrug resistance (MDR)-related solute carrier (SLC) and ATB-binding cassette (ABC) transporters, respectively[34,35]. A number of variables, including pH, drug concentration, and affinity, can affect the interaction between TKIs and transporters. As a result of insufficient intracellular drug concentration, these transporters can be responsible for intrinsic resistance.
The most studied ABC transporters implicated in MDR include P-glycoprotein (Pgp, ABCB1), multidrug resistance protein 1 (MRP1, ABCC1), and breast cancer resistance protein (BCRP, ABCG2). Due to a substrate-like characteristic, TKIs can be pumped outside the cells with an efflux mechanism at lower concentrations. However, at higher concentrations, TKIs can act as inhibitors.
TKIs usually inhibit ABC transporters without altering their expression or localization. As an example, cabozantinib competitively interacts with the drug-substrate binding site to decrease the ATPase activity of the ABCG2 transporter[36]. Pazopanib has both substrate-like and inhibitory effects. In the canine kidney cell line MDCKII, it was reported as both an ABCB1 and ABCG2 substrate and as an inhibitor of ABCB1 and its efflux characteristics[37-39].
Lysosomal sequestration is another mechanism of resistance based on drug physicochemical properties. This phenomenon is related to ABC transporters since these pumps are present on the membranes of intracellular compartments and regulate the drug’s influx into lysosomes[37,40,41]. Lysosomal sequestration has been shown to impact the effectiveness of the drugs sunitinib and pazopanib[42].
Lysosomal intake-induced resistance can be reversed. Indeed, after removing sunitinib from tumor cell culture, cell lysosomal capacity was restored, regaining drug sensitivity. This can give an explanation of the recovered sensibility to sunitinib experienced by patients after treatment interruption and subsequent rechallenge[37,42,43].
SECONDARY AND ACQUIRED RESISTANCE TO VEGFR-TKIs
Bergers and Hanahan categorize resistance to VEGFR-TKI as intrinsic or primary and adaptative or evasive (secondary)[44]. Sometimes, it was impossible to clearly and immediately shift the biological basis of these two types of resistance. The majority of the time, primary resistance could be explained by the abundance of angiogenic receptors and downstream pathways. However, the hypoxic state induced by VEGFR-TKI therapy could be responsible for an “angiogenic switch” towards a different molecular pathway, driving a different pattern of response [Figure 1].

Figure 1. Cross-talking between TKI receptors, hypoxia and growth factor receptors and relationship with tumor growth and resistance to TKIs. Several trans-membrane TKI receptors interact with each other and mediate the activation of shared pathways, most implicated in tumor growth and angiogenesis. TGFβ/Smad pathway and the interaction of some cytokines, such as IL-6 with their receptors, together with the Notch signaling pathway and wnt/β-catenin pathway induce EMT transcription factors and EMT as a mechanism of resistance to the inhibition of angiogenesis. Finally, hypoxia promotes both angiogenesis and EMT. AKT: Protein kinase B; AXL: AXL Receptor; EMT: epithelial mesenchymal transition. EMT-TFs: epithelial mesenchymal transition transcription factors; Erk1/2: elk-related tyrosine kinase; FGF: fibroblast growth factor; FGFR: fibroblast growth factor receptor; Gas6: growth arrest specific protein-6; GSK-3: glycogen synthase kinase 3 beta; HGF: hepatocyte growth factor; HIF: hypoxia-inducible factor; IGF: insulin growth factor; TGF-: tumor growth factor; IGFR: insulin growth factor receptor; JAK: janus kinase; Mek1/2: MAP kinase-ERK kinase; MET: hepatocyte growth factor receptor; mTOR: mammalian target of rapamycin; NFκB: nuclear factor kappa B; PDGFR: platelet derived growth factor receptor; PDGF-β: platelet derived growth factor-β; PI3K: phosphatidyl inositol 3-kinase; Raf: RAF proto-oncogene serine/threonine-protein kinase; Ras: rat sarcoma protein; STAT3: signal transducer and activator of transcription 3; VEGF: vascular endothelial growth factor; VEGFR: vascular endothelial growth factor receptor; VHL: von hippel-lindau protein.
Acquired resistance develops throughout treatment, usually following an initial response to therapy, and could be induced by the pressure of a specific therapy. The selection of particular clones that are resistant to therapy results in the progression of cancer. Additionally, cancers might develop resistance to a particular treatment through other pathways that are not affected by targeted therapy.
Tumor plasticity
A loss of cell polarity and contact promotes epithelial-mesenchymal transition (EMT). E-cadherin and other epithelial cell markers are downregulated during this transition, while mesenchymal markers including
Insulin-growth factor (IGF) signaling, which interacts with the NOTCH and Wnt/-catenin pathways, has been shown to be a modulator of EMT[56].
Sharma et al. provided evidence that sunitinib-treated RCC tumors underwent a mesenchymal transformation as seen by higher expression of N cadherin and decreased expression of E cadherin, which were both connected with an elevation of TGF and IGF1R. Patients with mRCC who expressed IGF1R and TGF and subsequently had EMT had worse outcomes, as shown by data from the Cancer Genome Atlas (TCGA) database[57].
Hwang et al. analyzed gene expression profiles and copy number variations of 10 metastatic ccRCC tumor samples before treatment and immediately after disease progression to a TKI. Microarray analysis of pre- and post-treatment ccRCC tumors demonstrated an increased expression of EMT-related genes including CD44, SNAI2, TWIST, and CLDN1 in TKI-resistant cells, acquiring migration and invasion capacity. In this study, the authors demonstrated that CD44 depletion significantly decreased cell invasiveness.
It may be crucial to understand the various pathways that underlie EMT and the indicators of this process in order to design strategies that combine therapies addressing both hypoxia and EMT.
Non-angiogenic pathway and by-pass pathways
Vascular co-option is a way to use pre-existing vessels. Using 164 lung metastasis specimens, Bridgeman
Furthermore, cancer resistance can arise when tumor cells employ other signaling pathways that are unaffected by VEGF/VEGFR suppression.
Fibroblast growth factor/fibroblast growth factor receptor pathway
Fibroblast growth factors (FGFs) are proteins that are involved in proliferation, differentiation, migration, and apoptosis of tumor cells[60].
FGF2, also known as basic FGF, has been recognized as a potential mediator of TKI resistance. Cell cultures were treated with VEGF and 100 nM sunitinib by Welti et al. Endothelial cell proliferation was restored by FGF1 and FGF2 to levels that were comparable to (FGF1) or greater than (FGF2) those seen in the absence of sunitinib[61]. Indeed, FGF2 induces angiogenesis through the activation of signaling pathways such as
MET/HGF signaling
When the hepatocyte growth factor/scatter factor (HGF/SF) binds to its receptor tyrosine kinase MET, the activation of the RAS-MAPK and PI3K-AKT pathways results in the development and angiogenesis of endothelial cells. HGF/SF-MET interaction is a potent regulator of the angiogenic switch. Common signaling intermediaries such as ERK-MAPK, protein kinase B (AKT), and focal adhesion kinase (FAK) are activated by both MET and VEGFR[65-68].
A remarkable new finding is that the MET/HGF pathway may be activated by hypoxia caused by blocking angiogenesis with VEGFR-TKIs in a HIF-mediated manner, hence increasing the MET-dependent spread of cancer cells[69-72].
Additionally, it is hypothesized a relationship between the MET axis and the immune system. Several immune cells, including mast cells, neutrophils, and dendritic cells (DCs), may have increased MET expression. MET/HGF-SF signaling could impact the ability of T cells to respond competently to cancer cells, by reducing the DCs’ capacity to present antigens and recruiting immunosuppressive cells. Therefore, MET inhibition may be a way to restore neutrophils and DCs’ capacity[73,74].
Cabozantinib is an oral multiple tyrosine kinase receptor inhibitor: VEGFR2, c-MET, and RET. Inhibition of VEGFR and c-MET decreases resistance to VEGFR inhibitors via the c-MET axis. However, resistance to MET inhibition can occur. Huang et al. reported some of the most common mechanisms inducing acquired resistance to HGF/MET-target therapy: hypoxia-induced MET phosphorylation reduction, with no effect on downstream signaling pathway, mutations in the MET kinase domain, bypass signaling, copy number changes and constitutive activation of AKT and ERK-MAPK pathway[73,75-77].
GAS6/Axl signaling
AXL is a receptor tyrosine kinase (RTK) that is a member of the TAM RTK. AXL signaling is implicated in tumor growth, EMT, angiogenesis, metastasis spread, and the development of resistance to targeted therapy. The AXL-ligand Gas6 is a vitamin K-dependent protein and the GAS6/AXL signaling can be constitutively activated in ccRCC cells[78-82].
Gustafsson et al. found that sunitinib enhanced Gas6-induced AXL phosphorylation in ccRCC, and consequentially activated the AKT pathway. Indeed, in the absence of sunitinib, the activation of the main MAPK pathways (ERK1-2, P38MAPK, and SAPK-JNK) by Gas6 alone was insufficient to activate AXL. Furthermore, it was shown that Gas6 activated the EGFR pathway when sunitinib was present. This pathway, along with AXL, is thought to be implicated in cancer’s resistance mechanism[83].
Cytokines
Treatment with sunitinib has been shown to increase the expression of IL-6 and IL-8. These cytokines have been linked to TKI resistance, suggesting that they could play an important role in inducing angiogenesis in a HIF-independent way. IL-6 activates the AKT/mTOR and transcription factor STAT3 cascade, resulting in increased expression of VEGFA and VEGFR2. In endothelial cells, IL-8 promotes the accumulation of VEGFA mRNA in normoxic conditions as well as the endothelial cells are exposed to hypoxia. Even when HIF-1 is blocked, CXCL8/IL-8 can still induce VEGFA promoter-driven transcription[84,85].
Pilskog et al. evaluated the expression of IL6R in RCC tumor cells and discovered that the expression of IL6Ra may predict responsiveness to TKI treatment. In fact, a significant correlation between IL6R expression and the objective response rate was identified but not with PFS or OS, indicating that IL6R expression may have predictive significance. IL-6 ligand expression may also play a prognostic role, as demonstrated by the association between its lack of expression or low expression with PFS[86,87].
Huang et al. developed sunitinib-resistant xenograft models and discovered that sunitinib-treated ccRCC cell lines developed resistance and displayed an elevated IL-8 expression. They observed that only when sunitinib treatment was sustained over a longer period did the reduction of IL-8 function decrease tumor growth. Only after the emergence of resistance to tyrosine kinase inhibition could IL-8 function inhibition affect tumor growth[88,89].
Tumor microenvironment and immune cells as mediators of TKI-resistance
There is growing interest in the connection between TIME, immune cells, and angiogenesis, and there is evidence that the tumor microenvironment has a direct role in the emergence of resistance to targeted therapies. The recently approved combination of ICIs and VEGFR-TKIs is also supported by this association. Therefore, it is critical to understand how TIME affects the mechanisms of resistance to target therapy in order to better understand resistance to combination therapy [Figure 2].
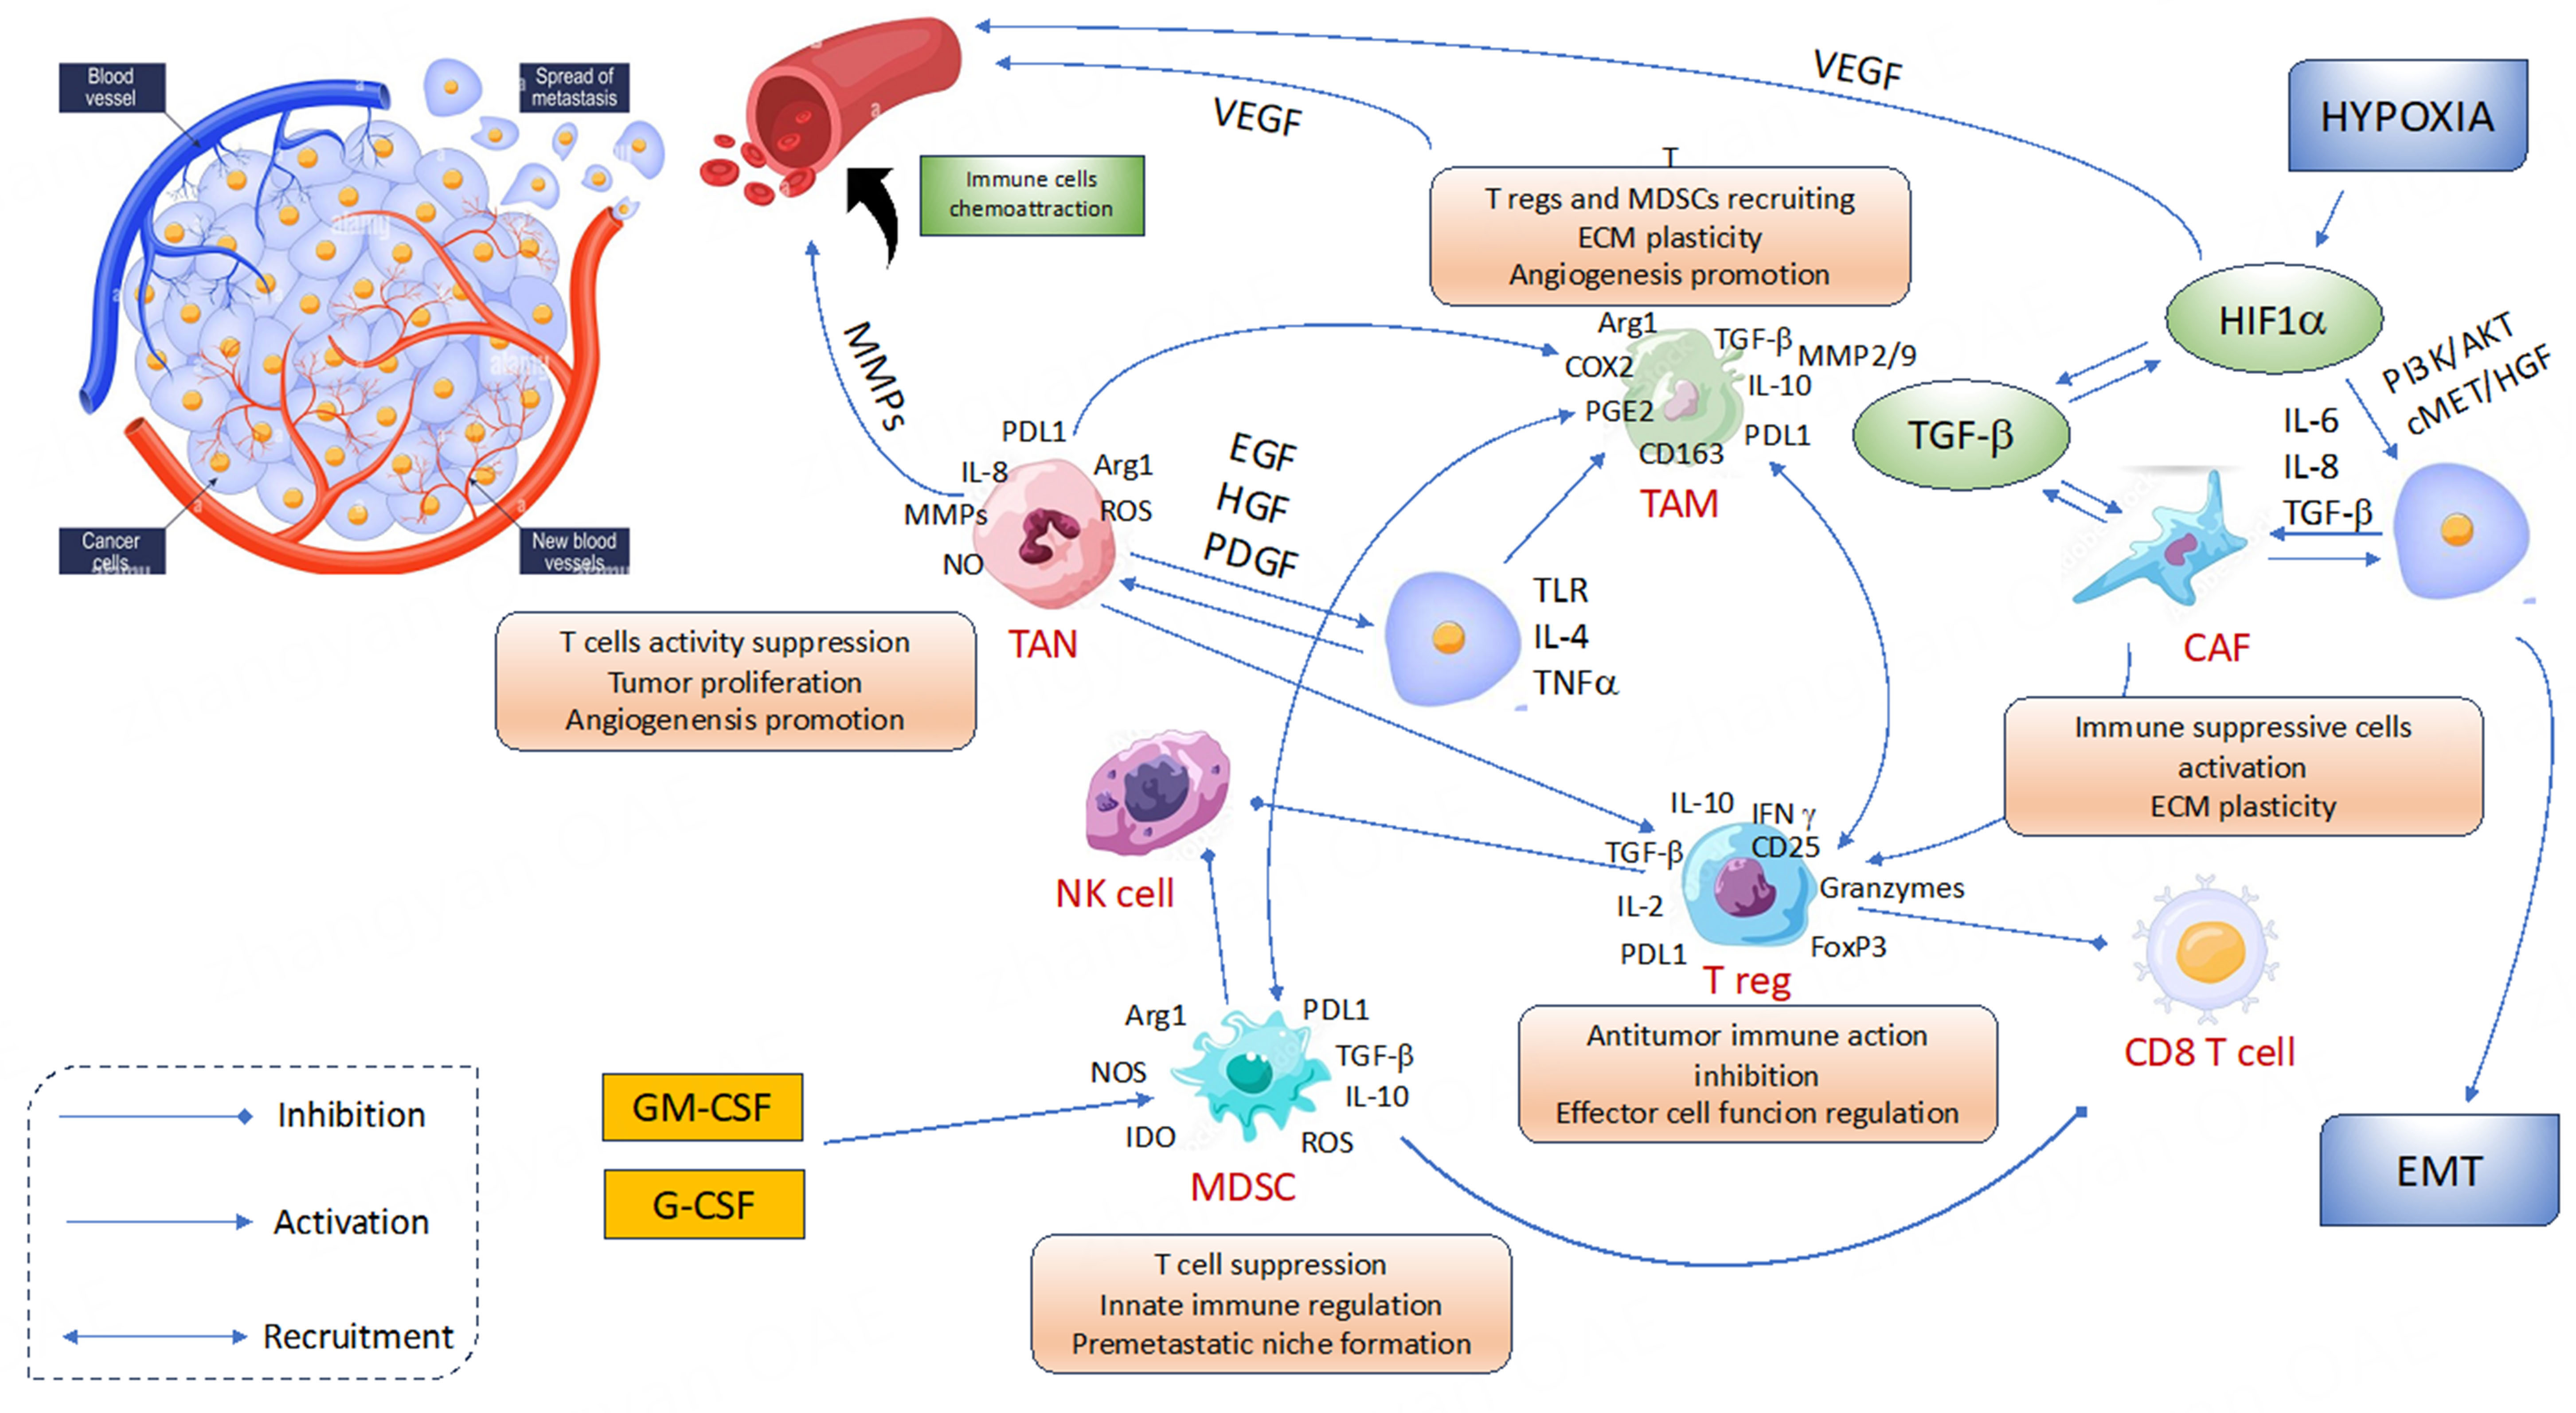
Figure 2. Interaction between angiogenesis and tumor microenvironment. Immune cells are recruited by chemokines and angiogenic factors and the tumor infiltration by immune cells is, in turn, implicated in promoting angiogenesis. The balance between immune response and immunosuppression is crucial to induce tumor killing from one side or tumor escape to the other. CAF: Cancer-associated fibroblasts; EGF: epidermal growth factor; EMT: epithelial-mesenchymal transition; G-CSF: granulocyte colony-stimulating factor;
MDSCs
MDSCs are the major component of TIME. Growing evidence indicates that tumors release pro-angiogenic signals that recruit MDSCs, which may act as mediators in the development of resistance to TKIs[91-94].
Ko et al. had demonstrated that sunitinib therapy significantly reduced MDSC accumulation in tumor-bearing mice models, leading to improved peripheral T-cell function. It appears that even when sunitinib diminishes peripheral MDSC accumulation, intra-tumoral MDSCs can be much less impacted. Intra-tumoral MDSCs from sunitinib-treated mice retained T-cell suppressive capacities comparable to those from untreated mice. The authors quantified MDSC subsets in tumor specimens of untreated and sunitinib-treated RCC. In contrast to the substantial reduction in peripheral blood MDSCs seen in RCC patients treated with sunitinib, the proportion of MDSCs in tumor samples nevertheless remained greater and these cells maintained their suppressive capabilities, as assessed by IFN production.
Additionally, sunitinib did not significantly affect the amount of GM-CSF produced by RCC tumors in vitro. Due to the stimulation of the STAT5 pathway, the pro-proliferative cytokine GM-CSF confers peripheral MDSCs sunitinib resistance. Sunitinib decreased pSTAT3 in the absence of GM-CSF, which made MDSCs more susceptible to the drug. In contrast, STAT5-mediated pathways are prominent in the presence of GM-CSF, resulting in a phenotype of MDSCs that is resistant to sunitinib[95].
These findings have been confirmed by Finke et al., who examined MSDCs both in peripheral blood and in tumors of RCC patients. They discovered that the sunitinib-induced maximum drop in MDSC numbers occurred after the second cycle and continued until later than the fourth cycle, although there is some recovery in MDSC levels at this point. In this study, the impact of pro-angiogenic factors on sunitinib resistance was also evaluated. Pro-angiogenic variables’ effects on sunitinib resistance were also assessed in this study. The analysis of tumor tissue lysates from patients who had neoadjuvant therapy revealed that there was an increase in the expression of pro-angiogenic proteins [Matrix metallopeptidase (MMP9), MMP8, and IL-8] in tumors with a greater level of MDSCs. Additionally, sunitinib causes an increase in plasma IL-8 levels, and larger levels are associated with a worse PFS. The presence of MDSCs in tumors might promote the production of IL-8, which could activate alternative pro-angiogenic pathways (MMP9/MMP8/IL8) to prevent cell death[96].
C Marcela Diaz-Montero et al. used a patient-derived xenograft (PDX) model of RCC and performed a microarray analysis of sunitinib-responsive and -resistant tumors. Resistance to sunitinib was associated with the upregulation of genes involved in cell movement and immune cell trafficking in both human and murine expression analyses. Furthermore, tumors resistant to sunitinib had higher levels of G-CSF and, consequently, higher levels of G-MDSCs. G-MDSCs are MDSCs that resemble granulocytes both phenotypically and functionally. G-MDSCs have the ability to inhibit the immune response, and they can additionally promote angiogenesis and the spread of tumors[97].
Cancer-associated fibroblasts
Tumor-growth factor (TGF) and platelet-derived growth factor (PDGF) induce the transformation of tumor fibroblasts (FHNR) in cancer-associated fibroblasts (CAFs), which play a key role in tumor progression, producing pro-tumoral cytokines (e.g., IL-6, IL-8, TNF, IL-10). Fibroblast-associated protein (FAP) is a marker of CAFs. Ambrosetti et al. demonstrated that high levels of FAP mRNA were correlated with shorter PFS and OS in metastatic ccRCC (PFS, P = 0.054 and OS, P = 0.022). Sunitinib stimulated FHNR to differentiate towards CAFs. Mice with induced mRCC were treated with sunitinib or with placebo. Compared to the placebo group, the sunitinib-treated mice’s tumors had higher FAP mRNA levels (P = 0.049). Sunitinib primary resistance has also been linked to CAFs, which create a barrier to the drug’s ability to reach tumor cells. Finally, CAFs appear to be a mediator of tumor cell EMT[98].
TAMs
Some of the most numerous immune cells identified within tumors are TAMs. Two subsets of TAMs are typically recognized: M1 and M2. M1-like TAMs have a pro-inflammatory phenotype and inhibit tumor growth, whereas M2-like TAMs have tumor-promoting capabilities involving immuno-suppression, angiogenesis, and neovascularization, as well as stromal activation and remodeling[99]. The functional phenotype M2-like is induced by hypoxia of the TIME, resulting in tumor escape[100].
In the genomic and transcriptomic analysis of ccRCC patients treated with TKIs in the COMPARZ phase III trial, Hakimi et al. observed significantly worse OS (HR 1.54; 95%CI: 1.17-2.03; P = 1.98) among subjects with high macrophage infiltration and higher macrophage infiltration (Kruskal-Wallis test, P = 0.02) in patients who experienced progressive disease. Furthermore, they found that a high M2-macrophage infiltration (M2high) was associated with poor OS (HR 1.38; 95%CI: 1.06-1.81; P = 0.019) and PFS (HR 1.40; 95%CI 1.09-1.78; P = 7.90) compared to the M2low group. Depending on the TKI used, macrophage infiltration and its impact on the outcomes differed. TAMs infiltration was a prognostic factor in patients receiving pazopanib but not sunitinib. This supports the notion that sunitinib primarily affects MDSCs[101].
TIL and TKIs interaction with immune-cell infiltration
TIL correlated with poorer prognosis and shorter survival in RCC[102]. Liu et al. compared the percentage of immune cells in TKI-exposed RCC tissue with control samples and they found an increased CD3+ T-lymphocyte infiltration, CD45RO+ T-lymphocyte infiltration, CD4+
Tregs infiltration was higher in sunitinib-treated patients with shorter OS and PFS. Finally, sunitinib directly enhanced PD-L1 expression, and those patients who had higher PD-L1 expression had shorter OS and PFS (P < 0.05) after receiving sunitinib treatment[103].
The analysis of T cell subsets and MDSCs in peripheral blood mononuclear cells (PBMCs) from ccRCC patients receiving cabozantinib and other therapies (nivolumab and pazopanib) revealed that T cell subsets composition changed after treatment. Indeed, cabozantinib treatment increased the proportion of Th9, Th22, and Th17 cells while having no effect on the number of Th2 cells, Th1, Treg, and CD8+ T cell populations. Among these T cells, the proportion of Th22, but not Th9, was associated with better outcomes[104].
Epigenetic modification
Non-coding and micro RNA
Non-coding RNAs, known as microRNAs (miRNAs), have significant functions in modulating the expression of genes. The role of miRNAs in resistance to TKIs is still being investigated[105].
Yamaguchi et al. conducted one of the first attempts to profile miRNAs in resistant RCC cell lines as they developed two sunitinib-resistant cell lines and performed microarray and RT-qPCR analysis on them. They identified seven miRNAs (miR-575, miR-642b-3p, miR-4430, miR-18a- 5p, miR-29b-1-5p,
It was reported that miR-4430 had a role in modulating expression genes implicated in the inhibition of PTEN/mammalian target of rapamycin (mTOR) signaling pathway. miR-18a-5p is associated with hypoxia-inducible factor 1 alpha (HIF1A)[106]. Sunitinib- resistant cell lines had higher miR-4430 levels and lower miR-18a-5p ones, suggesting that the acquisition of sunitinib resistance was associated with PTEN downregulation, and FGF1 and HIF1A upregulation[107] [Table 3].
Major determinants of primary and acquired resistance to VEGFR-TKIs
| Primary resistance to VEGF-TKIs | |
| Missed targets | VHL-deficient tumors with HIF2 expression[40,41] |
| Insufficient intracellular drug concentration | MDR-related solute carrier (SLC) and ATB binding cassette (ABC)[44-46] Lysosomal sequestration[47-50] |
| Secondary resistance to VEGF-TKIs | |
| Tumor plasticity | Epithelial-mesenchymal transformation (EMT) induced by hypoxia and Insulin-growth factor (IGF)[54-64] |
| Non-angiogenic pathways | Vascular co-option |
| Bypass pathways | FGF/FGFR: FGF2-mediated activation of ERK 1/2 and PLC pathway is not inhibited by sunitinib[68] MET/HGF: Hypoxia induced by VEGFR-TKIs promotes MET-depended tumor growth[76-79]. GAS6/AXL: VEGFR-TKIs treatment enhances the activation of the MAPK pathway by AXL[90]. |
| Tumor microenvironment interactions | Cytokines[91-93] ·IL-6 activates the AKT/mTOR pathway, inducing VEGFA and VEGFR2 expression. ·IL-8 induces VEGFA transcription even when HIF-1 is inhibited. MDSCs[100-102] ·GM-CSF confers sunitinib-resistance to peripheral MDSCs, via the STAT5 pathway. ·MDSCs produce pro-angiogenic proteins. CAFs[103] ·FAP mRNA (a marker of CAFs) levels are correlated with worse outcomes. TAMs[105-106] ·Hypoxia induces M2-macrophages phenotype. ·M2-like TAMs promote tumor growth. TILs[108] ·TKIs treatment induces CD4+ T cells and Tregs infiltration. ·CD4+ T cells and Tregs infiltration correlate with worse outcomes. |
| Epigenetic modifications | Non-coding RNAs and miRNAs[116] Sunitinib-resistant cells had higher miR-4430 (PTEN/mTOR signaling) and lower miR-18a-5p (FGF1 and HIF1A signaling) levels |
PRIMARY RESISTANCE TO ICIs
Availability of antigens and dendritic cells’ (DCs’) presentation of them, T-cell trafficking and tumor infiltration, T-cell effectiveness, and equilibrium between regulatory and cytotoxic cells in the TIME composition are all requirements for an immune response against tumor cells to be successful. Immune escape may occur in any of these phases, resulting in either primary or acquired resistance to immune checkpoint inhibitors[108].
Antigen availability and DCs presentation capacity
The recognition of a specific antigen by antigen-presentation cells (APCs) is the first step in a successful immune response. Major Histocompatibility Complex (MHC) proteins, which are classed as class I on all nucleated cells or class II on specific immune system cells such as macrophages, dendritic cells, and B cells, are also expressed on the surfaces of APCs. These proteins are necessary for the process of antigen presentation, which activates T cells in response to the antigen and results in a successful immune response[109].
Antigen availability may be influenced by the tumor mutational burden, and the absence of neoantigens may be caused by epigenetic alterations[110]. RCC has a relatively low mutational load. De Velasco et al. reported a low mutational load in their full exome transcriptome analysis of metastatic RCC patients included in TCGA, with a median of 1.42 mutations/Mb (range: 0.035-2.77). Classifying the 54 patients according to the IMDC risk criteria, no differences were seen in mutational load (P = 0.39), as well as in the expression of cytolytic genes - granzyme A (GZMA) and perforin (PRF1) - or in selected immune checkpoint molecules (PD-1, PD-L1, PD-L2, CTLA-4) (P > 0.05 for all)[111].
Lack of antigen presentation could be affected by MHC mutations or defects in DCs’ functions and maturation.
Beta-2-microglobulin (B2M), an important subunit of MHC class I, has essential biological functions and roles in tumor immunity. B2M gene deficiency and loss of Beta-2-microglobulin, induced by mutations and epigenetic regulation, can lead to complete loss of MHC class I antigen expression. B2M mutations frequently result in MHC defects that cannot be repaired, and immunotherapy is ineffective at restoring MHC expression[112].
The maturation of DCs can be influenced by numerous factors. Hypoxia, which creates an acidic environment with a higher amount of lactates, is one of these. Recent data suggests the existence of DCs with immune-suppressive characteristics. These cells may overexpress pathways involved in immune tolerance: e.g., STAT3 which induces S100A9, a gene that prevents DCs from maturing and recognizing antigens, or FOXO3, a transcription factor that induces the expression of indolamine 2,3-dioxygenase (IDO), arginase, and TGF-β and inhibits co-stimulatory molecules[113].
In the TIME, dendritic cells must already be present. A study conducted by Spranger et al. in melanoma murine models revealed that tumor-intrinsic active -catenin signaling results in T-cell exclusion and resistance to ICIs. Tumors with active -catenin exhibited a nearly complete absence of activated T cells, according to an analysis of immunological infiltrates. This absence was attributed to the loss of dendritic cells, particularly CD103+ dendritic cells with diminished IFN-β expression. The number of CD103+ dendritic cells was similarly decreased in the tumor-draining lymph nodes, but not in the spleen, thus reflecting the fact that these DCs were not recruited due to a defect in chemotactic signals, such as CCL4. Furthermore, when treated with dual checkpoint inhibition, no therapeutic effect in reducing tumor growth was detected in active -catenin mice. Re-introduction of dendritic cells restored tumor response to ICI[114].
Human endogenous retroviruses
Human endogenous retroviruses (hERVs) are components of about 8% of our genome that possibly originated by incorporating ancestral exogenous viruses. There are only a limited number of tools available for quantifying and identifying hERVs. They could be a source of neoantigen and mediate immune response in TIME. Smith et al. identified more than 3,000 transcriptionally active hERVs within the TCGA pan-cancer RNA-Seq database. They explored two mechanisms by which hERV expression could affect the tumor immune microenvironment in ccRCC. The first mechanism involved innate immune response and activation of the RIG-I-like pathway signaling by double-stranded RNAs (dsRNA). The second was related to the adaptive immune response, as documented by the hHERV epitope-trigged activation of the B cells. Patients with both RIG-I–like downregulation and BCR-associated signatures upregulation had significantly shorter overall survival, while those with higher expression of the RIG-I-like signature had longer overall survival. Two significant tumor-specific hERVs were lastly found in ccRCC (CT-RCC hERV-E and hHERV 4700). The CT-RCC hERV-E displayed a Treg signature and was the second most differentially expressed hERV. In an aPD1-treated ccRCC dataset, hERV 4700 (HERVERI/gammaretro-virus-like) expression was higher in tumor samples compared to normal tissue, and it was associated with response to immunotherapy. This could occur because hERV 4700-derived epitopes may be the target of an antitumor response mediated by aPD1 mAb[115,116].
Immune cell trafficking and recruitment
As discussed above, activation of the WNT/-catenin pathway reduces the recruitment of dendritic cells in TIME, affecting T-cell activation[114].
Given that pre-existing T-cells in the tumor are essential for response to ICIs, various mechanisms that may cause initial resistance to immunotherapy with the end result of the absence of immunologically competent cells in TIME have been investigated so far.
PTEN is a lipid phosphatase that inhibits the activity of PI3K/AKT signaling. PTEN loss has been associated with altered TIME T-cell composition. Peng et al. found that a lower CD8+ T cell tumor infiltration was present in melanomas with PTEN loss compared to tumors with PTEN expression (P < 0.001). Furthermore, PTEN loss resulted in both an up-regulation of inhibitory cytokines including CCL2 and VEGF and a down-regulation of the T cell effector molecules IFN- and granzyme B. Since PTEN loss and PI3K/AKT pathway signaling both contribute to immunotherapy resistance, it is possible to reverse this effect by targeting the PI3K-AKT pathway[117].
T-cell activity in TIME and microenvironment composition
T cells get activated when they come into contact with APCs and the MHC complex through the TCR. Following this, T cells mostly develop into cytotoxic T cells (CD8+ cells) or T-helper (Th) cells (CD4+ cells), and they release cytokines that further regulate the immune response[108]. Cytotoxic CD8+ T lymphocytes are mainly responsible for killing tumor cells. MHC class II proteins trigger the activation of CD4+ Th cells, which lack the ability to cause cytotoxicity. In fact, they are implicated in the recruitment of additional immune cells, producing cytokines. IFN-γ is a mediator of the Th1 cell response[109].
As tumors grow, persistent exposure to IFN-γ may be responsible for a down-regulation of IFN signaling downstream, resulting in primary immunotherapy resistance. Mutations in IFN receptors, Janus kinases JAK 1/JAK2, are studied mechanisms by which cancer cells could have an advantage in developing resistance to IFN-mediate anti-proliferative effects. Shing et al. discovered that loss of function mutations in JAK1/2 in melanoma cells could inhibit T cells killing capacity and IFN’s ability to induce PD-L1 expression, making pharmacological suppression of the PD-L1/PD-1 interaction ineffective. Reduced T-cell trafficking, along with decreased production of chemokines such as CXCL9, CXCL10, and CXCL11, could potentially account for the lack of response[118].
For a competent immune response to be effective, there must be a balance between cells that inhibit immunity and cells that promote response inside the tumor microenvironment. TME is dynamic and constantly changes. The TIME of ccRCC is unusual, and it is distinguished by a strong inflammatory profile and T-cell infiltration. The primary immunosuppressive cells in TIME are TAMs, MDSCs, and regulatory
TAMs
In ccRCC, cancer-cell-derived factors such as IL-1β, IL-6, IL-10, tumor necrosis factor-α, epidermal growth factor, and TGF-β induce macrophage polarization towards a M2 phenotype by cell-cell interactions. CD163+ M2 TAMs contributed to poor clinical prognosis in patients with ccRCC by activating STAT3 pathway. PI(3)Kinase γ (PI3Kγ) is found to be implicated in themacrophage switch from a M1-phenotype to a M2-phenotype, inhibiting Akt and mTOR together with the NFκB and C/EBPβ activation. As a result, the immune suppressive phenotype promotes tumor growth and inflammation[120,121].
Tregs
Through the production of IL-10 and TGF-, Tregs can mediate immunosuppression by inhibiting T cells and APCs functions. These cells can be recruited in TIME by chemokines and cytokine produced by exhausted T-cells. Furthermore, cancer cells can play out escape mechanisms upregulating Tregs in TIME[109]. Hyperactivation of focal adhesion kinase (FAK) (also known as FADK) in tumor cells induces overexpression of various chemokines (including CCL5), thus recruiting Treg cells and inducing CD8+
Immune checkpoints like CTLA-4 and PD-1 are expressed by Tregs as well. In human glioblastoma tissue, Tregs with high PD-1 exhibit an exhausted phenotype lacking immunosuppressive activity. Anti-PD-1 mAbs may cause hyper-progression, decreasing the number of Tregs that express PD-1 and restore their ability to inhibit immunological response[121,123-125].
The contribution of the B7x immunological checkpoint to the growth of the Treg population within the tumor was discussed by John et al. In accordance with their suppressive function, B7x+ Tregs exhibited a higher level of TGF-LAP (a surface marker of TGF production) and a lower percentage of ki67 marker, indicating that they originated from peripherally converted CD4+ T cells. B7x increased Foxp3 expression through increasing STAT5 phosphorylation, whereas it inhibited STAT3 phosphorylation, which affected CD4+ T cells’ ability to differentiate into the Th17 subtype. What is more intriguing is that the anti-CTLA-4 therapy was not successful in reducing Tregs exclusively in mice that expressed B7x+. In addition, B7x+ mice showed a substantial reduction in the IFN production generally caused by anti-CTLA-4. Tregs play a crucial part in the immune response, as shown by the fact that Treg depletion restored anti-CTLA-4 capabilities in tumor reduction even in B7x+ mice[126].
MDSCs
MDSCs may differentiate into M2-polarized macrophages with immunosuppressive properties and can decrease T-cell activation by metabolic processes (e.g., iNOS, IDO). Additionally, they are able to express CD40 and to produce TGF- and IL-1, leading to Tregs expansion and decreasing the capacity of effector
DCs
According to their presence in Tertiary lymphoid structures (TLS), DCs in ccRCC can be divided into two subtypes: TLS-DCs (CD83+ DC- LAMP+), which are very uncommon in ccRCC and associated with good outcomes, and non-TLS-DCs (CD209+ CD83), which are dominant in ccRCC TIME and associated with the worst prognosis. In addition to promoting tumor growth by secreting MMP-9 and TNF, NTLS-DCs further inhibit CD8+ T-cell activity by the L-arginine pathway and trigger Treg responses by secreting
Genomic and single-gene mutation and TIME
The biomarker analyses conducted among patients treated in the IMmotion 150, the Javelin Renal 101 and the Checkmate 214 had developed the idea that gene expression profile (GEP) in RCC could predict response to ICIs[22-24].
Based on mRNA expression data, Beuselinck et al. performed a clustering analysis and identified four molecular subgroups of ccRCC, even if done in a cohort of patients receiving sunitinib: ccrcc1
In the BIONIKK trial, the authors used Beuselinck’s clustering classification to undertake a biomarker-driven analysis. Patients with the ccrcc 1 and 4 subtypes were randomized to receive nivolumab either alone or in combination with ipilimumab, whereas those with ccrcc 2 and 3 could receive either nivolumab plus ipilimumab or a VEGF-TKI. In the ccrcc1 (immune desert subtype), ORR and PFS were improved by the dual checkpoint inhibition (HR of PFS for nivolumab vs. nivolumab + ipilimumab 1.27; 95%CI 0.77-2.11). In the ccrcc4 (immune infiltrated and inflammatory subtype), both nivolumab alone and in combination with ipilimumab obtained higher ORR and longer PFS compared to the ccrcc 1 group. Thus, ccrcc4 seemed the best candidate for dual checkpoint inhibition. Furthermore, about 30% of patients in the ccrcc4 group who early progressed on nivolumab–ipilimumab did not start a second-line therapy, thus reflecting that progression at first evaluation, does not always indicate resistance[131].
PBRM1 and BAP1
PBRM1 encodes for BAF180, a component of the SWI/SNF chromatin remodeling complex and could be inactivated in about 36% of clear cell renal cell carcinoma. Its relationship with prognosis in RCC has been evaluated in several studies, resulting in conflicting findings. PBRM1 mutations have also been documented in VHL-disease-associated RCC. PBRM1 and VHL mutations were most frequently expressed in ccrcc1 subtypes (immune desert one)[131-134]. In the phase I CA209-009, 35 samples of RCC treated with Nivolumab were whole-exome sequenced and were consequently divided into three categories according to responses. Clinical response to Nivolumab was characterized by a higher percentage of PBRM1 loss-of-function. The same results were seen in a subgroup treated with nivolumab plus ipilimumab[135].
As reported above, in the molecular subsets analysis of the IMmotion 151, PBRM1 mutations conferred better outcomes to patients, regardless of the treatment arm. However, in patients with PBRM1-non-mutant tumors, the addiction of immunotherapy to a VEGFR-TKI confers better outcomes compared to target therapy alone[31].
SETD2
SETD2 mutations, a histone methyltransferase gene, occur in 10% of ccRCC. Wang et al. clustered TGCA RCC samples based on TME expression profiles and observed two different clusters: the first cluster, inflamed subtype (IS), was enriched for Treg cells, NK cells, Th cells, neutrophils, macrophages, eosinophils, B cells and CD8+ T cells, whereas the second cluster, not inflamed subtype (NIS), was enriched for angiogenesis, plasmacytoid DCs, and mast cells. Mutations in BAP1 were most frequently seen in the IS
GUT MICROBIOME INFLUENCES PRIMARY RESISTANCE TO IMMUNOTHERAPY
The complex system of the gut microbiota interacts with the host. By producing neoantigens and modifying the tumor immunological microenvironment, microorganisms have an impact on immune responses. Furthermore, studies have revealed that antibiotics can affect the metabolic balance of the intestinal microbiome by increasing some species while decreasing others, leading to dysbiosis[137-140].
Routy et al. demonstrated that the use of antibiotics (ATB) influenced response to ICIs in non-small cell lung cancer (NSCLC), RCC and urothelial cancers. As evidenced by poorer outcomes for individuals receiving antibiotic treatment, ATB usage did, in fact, cause resistance to PD-1 blockade in all tumor types. Analyzing the microbiome composition, Akkermansia muciniphila conferred better PFS to patients treated with immunotherapy. Th1 and Tc1 cell reactivity against A. muciniphila was the only immune response to ICIs that was associated with clinical outcomes[138].
De rosa et al. confirmed that ATB impaired patients’ responses to immunotherapy by altering the diversity and composition of gut microbiota in a metagenomic and network analysis of patients treated with nivolumab in the NIVOREN GETUG-AFU 26 phase 2 trial. Responders had an over-representation of distinct species including A. muciniphila, Bacteroides salyersiae, and Eubacterium siraeum, and a trend towards Clostridium ramosum and Alistipes senegalensis, whereas E. bacterium_2_2_44A, Clostridium hathewayi, and Clostridium clostridioforme were more represented in non-responders, as observed for those patients using ATB. Due to the fact that the majority of patients had already received a VEGF-TKI, the authors examined the effects of TKI use in combination with ATB on microbiome composition and discovered that axitinib + ATB was the most effective treatment to induce a shift in fecal microbiota. Additionally, most notably with cabozantinib, TKIs promoted a transition to a preponderance of immunostimulatory commensals, such as A. senegalensis and A. muciniphila. This property could be one of the rational bases for combining VEGFR-TKI with ICIs[141].
ACQUIRED RESISTANCE TO IMMUNE CHECKPOINT INHIBITORS
Secondary resistance develops throughout therapy and may be driven by the stress that a particular therapy might have on TIME, as well as by temporal variability and plasticity. The same mechanisms that lead to initial resistance also cause secondary resistance to immune-checkpoint inhibitors. Some investigators observed that TILs (the immune response’s effectors) are present during relapse but remain restricted to the tumor margin, raising the possibility that these cells have lost the ability to identify antigens or to activate themselves. Utilizing ICIs, the IFN-induced expression of PD-L1 and its negative effects on CD8+ T cells are prevented. To reduce antigen presentation or enable escape from interferon-induced growth inhibition, cancer cells may, however, become insensitive to IFN signaling. JAK mutations have been investigated as a strategy by which cancers develop IFN unresponsiveness[142].
Numerous investigations conducted on humans have shown that tumor cells can develop resistance to
Chronically activated Treg cells showed strong suppressive potential. Tregs increase CD103 expression when activated, and CD103+ Treg exhibited greater levels of inhibitory receptors such as PD-1, TIM-3, and CTLA-4. Additionally, they upregulate functional molecules, granzyme B and IL-10, which are essential to their suppressive actions, such as the decrease in CD8+ T cells[147].
ALTERNATIVE INHIBITORY RECEPTORS UPREGULATION AS A MECHANISM OF ACQUIRED RESISTANCE
Exhausted CD8+ T cells lose their cytotoxic efficacy against presented antigens. PD-1 is only one of the inhibitory receptors highly expressed on exhausted CD8 T cells and its blockade may have a therapeutical effect. However, blocking this pathway does not completely restore T cell function. Numerous alternative inhibitory receptors, primarily identified in chronic infections, such as LAG-3, TIM-3, 2B4, CD160, or BTLA, are overexpressed in exhausted T cells and may be targeted to enhance immune response or reverse resistance[147,148].
PD-1
PD-1 is an inhibitor of both adaptive and innate immune responses, and it is expressed on activated T, natural killer (NK) and B lymphocytes, dendritic cells (DCs), macrophages, and monocytes[149]. In a cohort of patients with NSCLC, gastric cancer (GC) and melanoma treated with Nivolumab, CD8+ T cells of the TIMEs from responders expressed higher levels of PD-1 than those from non-responders. Furthermore, PD-1 was highly expressed in eTreg (CD45RA−CD25hiFoxp3hiCD4+) of the TIME of patients with NSCLC and GC which not responded to nivolumab. In this context, the use of aPD-1 mAb could have immunosuppressive effects, enhancing the expression of PD-1 among eTreg, and thus stimulating Treg functions[150].
PD-1 expression balance between CD8+ T cells and Treg cells is crucial for the efficacy of monoclonal antibodies to PD-1.
The prognostic value of PD-L1 expression in RCC is controversial. A meta-analysis of four trials assessed the predictive value of PD-L1 among patients treated with nivolumab + ipilimumab, atezolizumab + bevacizumab, pembrolizumab + axitinib or avelumab + axitinib vs. sunitinib. Patients with PD-L1-positive tumors showed significantly improved ORRs, complete response rates (CRRs) and PFS, and lower progression disease responses (PDRs) compared with those with PD-L1-negative tumors when treated with ICIs vs. sunitinib. Nivolumab plus ipilimumab had the highest likelihood of providing the maximal PFS (p score: 0.90) and the highest ORR (p score: 0.95)[151].
Overall, even though the findings of this study show that PD-L1 has a predictive value, there are several limitations, such as the fact that PD-L1 is expressed differently in primary tumors compared to metastatic sites, as well as the lack of a standard detection method and the different types of anti-PD-L1 antibody used. Examining the variable pattern of PD-L1 expression on different immune cells in TIME might be more fascinating than examining its expression just on tumor cells. As reported, it appears that the effectiveness of ICIs depends on the balance between PD-1 expression on CD8+ T-cells and Treg.
LAG3
Lymphocyte Activation Gene-3 (LAG3; CD223) is expressed on activated human NK and T cell lines and is able to bind MHC class II. A soluble monomeric form of LAG3 (sLAG3) can be released by IFN-producing CD4+ T cells. The major ligand of LAG3 is MHC class II. Melanoma cells that express MHC class II attract tumor-specific CD4+ T cells through their interaction with LAG3, resulting in impairing CD8+ T cell responses. Other putative ligands are Galectin-3, which mediates suppression of CD8+ T-cell-secreted IFN in vitro and LSECtin (liver sinusoidal endothelial cell lectin). It was found that the association between LAG3 and the LSECtin ligand inhibits the generation of IFN by effector T cells that are antigen-specific in melanoma cells. Dendritic cell inhibition is one of the ways whereby LAG3-expressing Tregs interact with MHC class II to cause immunological suppression. In fact, when exposed to LAG-3, MHC class
In a study examining the key inhibitory receptors (iR) expression on TILs and PBMCs of 35 patients with RCC, CD8+ T cells and non-Treg CD4+ cells highly expressed the inhibitory receptors PD-1, followed by LAG-3 and BTLA, whereas Tim-3 and CTLA-4 were less highly expressed. However, the expression profile of the five iR on tumor-infiltrating Tregs was different. Indeed, Tregs upregulated PD-1, LAG-3, Tim-3, and CTLA-4, but not BTLA. Interestingly, as previously reported, the most frequent iR combination was PD-1 and LAG-3, whereas about 10% of CD8+ T cells expressed PD-1, LAG-3 and Tim-3 simultaneously. Experimental in vitro demonstrated that blockade of PD-1 plus LAG-3 resulted in a statistically significant higher percentage of CD8+ IFN+ T cells, than blockade of PD-1 alone.
Additionally, when CD4+ and CD8+ T cells were co-cultured with anti-PD-1, LAG3 upregulated but not PD-1. These findings suggested that blocking LAG-3 in combination with PD-1 might be an effective treatment for advanced RCC[156].
TIM-3
T cell immunoglobulin and mucin-domain containing-3 (Tim-3) is a type I trans membrane protein expressed in IFN-γ-producing Th1 and Tc1 cells. The expression of cytokines such as TNF and INF-γ and Th1 responses are significantly suppressed by Tim-3. Tim-3 is linked to T cell exhaustion and its expression on CD8+ T cells is directly related to PD-1. Indeed, CD8+ T cells co-expressing Tim-3 and PD-1 are “deeply” exhausted T cells. Tim-3 could be expressed on tumor-infiltrating DCs, playing a role as a mediator of the innate immune response. The Tim-3 ligand with the highest affinity is galectin-9, and its interaction with Tim-3 causes the death of effector Th1 cells and CD8+ T cells. Furthermore, galectin-9 increases Tim-3-mediated IFN production in NK cells, activates PI3K-mTOR signaling in myeloid cells, and alters cytokine production by monocytes/macrophages, affecting Th1 and Th17 responses.
Other theorized ligands are being researched. Galectin-9 and Ceacam1 collaborate, both having a comparable effect. Activated DCs release the damage-associated molecular pattern known as HMGB1 (high-mobility group box 1), which stimulates T and B cell responses while inhibiting innate immune responses to tumor-derived nucleic acids. Tim-3 signaling’s impact is influenced by the ligands involved, the cellular environment, and the biological state, particularly whether the stimulation is acute or persistent. Tim-3 can have adjuvant effects inducing the expression of co-stimulatory receptors. In contrast, chronic stimulation could enhance the inhibitory functions of Tim-3 signaling, especially as concerns HLA-B associated transcript 3 (Bat3) deficient Th1 and CD8+ T cells, driving these cells to an exhaustion stage[157-164].
Expression of Tim-3 on T cells also plays a critical role in the generation of MDSCs and is even present in FoxP3+ T regs, contributing to promoting T cell dysfunction and immune suppression[165,166].
In isolated CD8+ T cells, Tim-3+PD-1+ TILs were identified as an exhausted phenotype of T cells, having a reduced production of IL-2, TNF, and IFN-γ. Combining anti-Tim-3 and anti-PD-L1 therapy reduced the tumor growth in mouse models, and those who underwent a complete regression continued to be tumor-free even after rechallenging[167].
Tim-3 expression in RCC has been associated with outcomes resulting in contradictory results. Patients receiving nivolumab were assessed in the CheckMate-010 research study conducted by Pignon et al. in anattempt to identify the mechanisms causing different responses. Longer median immune-related response progression-free survival (irPFS) and higher ORR were associated with the presence of CD8+ tumor-infiltrating cells that express PD-1 but lack LAG3 and TIM3 and are more likely to be T cell activated. This is in contrast to Zelba et al.’s findings, which showed that blocking both PD-1 and Tim-3 simultaneously had no effect on the average cytokine production by TILs, resulting in a lack of the immune response’s restoration. Therefore, additional research is required to confirm the usefulness of Tim-3 as a possible target to enhance immune responses driven by the inhibition of checkpoint inhibitors[168,156] [Table 4].
Major determinants of primary and acquired resistance to ICIs
| Primary resistance to ICIs | |
| Antigen availability | mRCC has a low mutation load |
| Antigen presentation defects | Beta-2 microglobulin loss might result in a deficiency of MHC class I expression. |
| Absence of dendritic cells (DCs) | Due to defects in chemotactic signals, active -catenin signaling causes the depletion of DCs. |
| Antigen epigenetic modification | hHERVs may influence both innate and adaptative immune responses. |
| Cells trafficking and recruitment alterations | ·WNT/-catenin pathway activation reduces DCs recruitment. ·PTEN loss reduces CD8+T cell infiltration. |
| T-cell activity inhibition | JAK1/2 loss of function mutations inhibit T cell killing efficacy and IFN-mediated PD-L1 expression. |
| Tumor microenvironment composition | TAMs ·M2-like TAMs correlate with worse prognosis in mRCC Tregs ·Anti-CTLA-4 mAbs are not effective in depleting Tregs expressing B7x immune checkpoint. MDSCs ·Low MDSCs infiltration correlates with better outcomes with ICIs DCs ·A specific subtype of DCs (NTLS-DCs) with immunosuppressive functions is dominant in ccRCC. |
| Genomic and single-gene mutations | PBRM1 ·Regardless of the type of treatment utilized, PBRM1 mutations are correlated with better results. ·Combining VEGFR-TKI with ICI is more effective in PBRM1 non-mutant tumors. ·PBRM1 mutations are more frequent in non-inflamed, angiogenic subtypes. SETD2 ·SETD2 mutations are enriched in inflamed immune infiltrated subtypes. |
| Gut microbiome composition | Antibiotic use induces resistance to aPD-L1 mAb Different bacterial species are represented in responders vs. non-responders |
| Secondary resistance to ICIs | |
| Same mechanisms involved in primary resistance | ·IFN unresponsiveness via JAK mutations ·HLA I defects. ·Loss-of-function of Beta-2 microglobulin mutations. |
| Alternative inhibitory receptors | ·LAG3 ·TIM-3 |
CONCLUSIONS
Metastatic renal cell carcinoma management has undergone a paradigm shift as a result of the development of combination therapy using ICIs. The choice of first-line treatment and its correct application continues to be crucial factors in tumor evolution and have the potential to cause initial resistance, which may have an impact on overall survival. Because of this, it is now crucial to understand how the combination of ICIs or the addition of a VEGF-TKI to immunotherapy may alter the tumor microenvironment and affect the tumor’s response to treatment. Targeting hypoxia with specific drugs may be a possibility to enhance outcomes in RCC since hypoxia is a defining feature of RCC pathogenesis and is associated with both angiogenesis and the alteration of the tumor microenvironment. HIF-2 inhibitor belzutifan is being tested in patients with previously treated mRCC as a single treatment versus everolimus (NCT04195750) or in combination with lenvatinib versus cabozantinib (NCT04586231). Different inhibitory receptors or metabolic pathways may be the focus of alternative approaches. The phase II trial FRACTION-RCC is studying an anti-LAG3 mAb (relatlimab), in combination with nivolumab (NCT02996110). XmAb®22,841, a bispecific antibody targeting CTLA-4 and LAG-3, is under study in the phase I trial DUET-4 (NCT03849469). A randomized phase II trial is investigating the efficacy of axitinib combined with an antibody against OX40, a receptor expressed on memory T cells (NCT03092856). In a phase 1b/2 trial, patients with previously treated mRCC are being treated with cabozantinib in conjunction with the anti-AXL fusion protein AVB-S6-500, which controls the GAS6/AXL signaling pathway (NCT04300140).
Despite the previously mentioned advancements, there is still a significant research gap in the individual biology of tumors. Furthermore, there is no trustworthy biomarker to direct patient selection. The dynamic genomic and immunomodulatory alterations that systemic treatment causes in the TIME in advanced ccRCC may help to partially explain this paucity of biomarkers.
It may be possible to predict therapy response by combining tumor genomic and immune signatures, but much more accurate research is needed to link biological understanding with clinical findings in RCC.
We must change how we approach treating ccRCC due to the advent of clinical resistance to the currently available systemic treatments. Cancer cells are constantly changing as a result of therapy pressure, plasticity, and heterogeneity. We may be able to comprehend, avoid, and overcome resistance mechanisms by estimating the trajectory of ccRCC evolution. In the prospective cohort study TRACERx, the authors conducted a whole genome sequencing of RCC tumor samples to generate information on the timing of driver mutations, level of intratumoral heterogeneity, and presence of parallel evolution in each patient. They found that the loss of heterozygosis of chromosome 3p was the first critical driving event. The most frequent alteration was rearrangement between 3p and 5q (one copy of 3p lost and one copy of 5q earned), defined t (3:5) chromothripsis. Using t (3:5) as the cut-off, they calculated the chronological age at which each mutation occurred. They found that the duplication that caused t (3:5) chromothripsis was an early event (35-50 years before tumor diagnosis), causing a modest initial clonal expansion, and that the mutation rate throughout life remained constant. Due to the latency between the triggering mutational event and subsequent progression, there may be a window for early intervention to prevent RCC. Indeed, the incidence of sporadic RCC could be decreased by reducing the 3p-LOH clone size by 50%. This is reasonable given that this chromosome contains four tumor-suppressor genes (VHL, PBRM1, BAP1, and SETD2) that are crucial for cellular survival[169].
Based on seven evolutionary subgroups that coincide with clinical characteristics, ccRCCs have been divided into four groups[169,170]. These groups are distinguished by four features-variations in chromosomal complexity, intra-tumor heterogeneity (ITH), model of tumor evolution, and metastatic potential.
In a review by Kowalewski et al., the authors investigate single group characteristics and describe possible evolution-target strategies according to the evolutionary trajectories. Group 1 tumors are those that have a single VHL mutation and a low genome instability index (wGII), as well as low ITH. Given the positive predictive significance of a low wGII as a measure of response to ICIs, this group may benefit from immunotherapy. Furthermore, a stable tumor burden could be reinforced by adaptative therapy, upfront cytoreductive nephrectomy (CN), and treatment targeting trunk group before the loss of 9p or 14q, which marks the acquisition of metastatic competence. Group 2 tumors are those with an early PBRM1 mutation and a subsequent SETD2 mutation, PI3K pathway mutation, or high wGII, and were distinguished by a “branched” evolutionary pattern. In this group, modulating genomic instability could be useless, whereas targeting immune evasion could be an option. In contrast, Group 3 and 4 tumors are those with multiple driver mutations (VHL plus ≥ 2 BAP1, PBRM1, SETD2, or PTEN) resulting in “punctuated” evolution and characterized by high wGII. ITH is low in group 3 tumors but higher in group 4 tumors, giving that group a rapid dissemination pattern. Due to high wGII and a punctuated evolution pattern in Groups 3 and 4, it may be effective to address genomic instability by enhancing it. The goal of evolutionary herding is to reduce ITH and manage any potential distinct clones that may result from a prior treatment by utilizing a combination of drugs in a specific order. Hence, it should be considered in Groups 1 and 3[171].
We might be able to transpose this perspective into the real world with the aid of new technologies. For instance, the repeated evolution in cancer (REVOLVER) machine-learning algorithm was created to achieve repeatable disease prognosis based on next-generation sequencing (NGS) count data, thereby classifying patients based on the evolution of their tumors over time[172]. Trials including biomarkers and evolutionary paths as drivers of chosen treatment will be the new challenge in the future, in order to predict earlier the correct strategy and to prevent a manipulation that could be harmful when applied in the incorrect evolutionary trajectory.
DECLARATIONS
Authors’ contributionsConceptualization, formal analysis, resources, data curation, writing - original draft: Astore S
Data curation, resources, software, writing - review and editing: Baciarello G, Cerbone L
Validation, supervision, project administration, writing - review, project administration: Calabrò F
Availability of data and materialsNot applicable.
Financial support and sponsorshipNone.
Conflicts of interestSA declares no conflicts of interest. FA is a consultant/member of the external advisory board for Pfizer, BMS, Ipsen, MSD, AstraZeneca, Merck and Accord.
Ethical approval and consent to participateNot applicable.
Consent for publicationNot applicable.
Copyright© The Author(s) 2023.
REFERENCES
1. Hahn AW, Klaassen Z, Agarwal N, et al. First-line treatment of metastatic renal cell carcinoma: a systematic review and network meta-analysis. Eur Urol Oncol 2019;2:708-15.
2. Motzer RJ, Powles T, Burotto M, et al. Nivolumab plus cabozantinib versus sunitinib in first-line treatment for advanced renal cell carcinoma (checkmate 9ER): long-term follow-up results from an open-label, randomised, phase 3 trial. Lancet Oncol 2022;23:888-98.
3. Albiges L, Tannir NM, Burotto M, et al. Nivolumab plus ipilimumab versus sunitinib for first-line treatment of advanced renal cell carcinoma: extended 4-year follow-up of the phase III checkmate 214 trial. ESMO Open 2020;5:e001079.
4. Motzer RJ, McDermott DF, Escudier B, et al. Conditional survival and long-term efficacy with nivolumab plus ipilimumab versus sunitinib in patients with advanced renal cell carcinoma. Cancer 2022;128:2085-97.
5. Powles T, Plimack ER, Soulières D, et al. Pembrolizumab plus axitinib versus sunitinib monotherapy as first-line treatment of advanced renal cell carcinoma (KEYNOTE-426): extended follow-up from a randomised, open-label, phase 3 trial. Lancet Oncol 2020;21:1563-73.
6. Choueiri TK, Motzer RJ, Rini BI, et al. Updated efficacy results from the JAVELIN Renal 101 trial: first-line avelumab plus axitinib versus sunitinib in patients with advanced renal cell carcinoma. Ann Oncol 2020;31:1030-9.
7. Choueiri TK, Eto M, Motzer R, et al. Lenvatinib plus pembrolizumab versus sunitinib as first-line treatment of patients with advanced renal cell carcinoma (CLEAR): extended follow-up from the phase 3, randomised, open-label study. Lancet Oncol 2023;24:228-38.
8. Heng DY, Xie W, Regan MM, et al. Prognostic factors for overall survival in patients with metastatic renal cell carcinoma treated with vascular endothelial growth factor-targeted agents: results from a large, multicenter study. J Clin Oncol 2009;27:5794-9.
9. Heng DY, Xie W, Regan MM, et al. External validation and comparison with other models of the international metastatic renal-cell carcinoma database consortium prognostic model: a population-based study. Lancet Oncol 2013;14:141-8.
10. Rooney MS, Shukla SA, Wu CJ, Getz G, Hacohen N. Molecular and genetic properties of tumors associated with local immune cytolytic activity. Cell 2015;160:48-61.
11. Şenbabaoğlu Y, Gejman RS, Winer AG, et al. Tumor immune microenvironment characterization in clear cell renal cell carcinoma identifies prognostic and immunotherapeutically relevant messenger RNA signatures. Genome Biol 2016;17:231.
12. Gabrilovich DI, Nagaraj S. Myeloid-derived suppressor cells as regulators of the immune system. Nat Rev Immunol 2009;9:162-74.
13. Schreiber RD, Old LJ, Smyth MJ. Cancer immunoediting: integrating immunity’s roles in cancer suppression and promotion. Science 2011;331:1565-70.
14. Chevrier S, Levine JH, Zanotelli VRT, et al. An immune atlas of clear cell renal cell carcinoma. Cell 2017;169:736-749.e18.
15. Kaelin WG Jr. The von Hippel-Lindau gene, kidney cancer, and oxygen sensing. J Am Soc Nephrol 2003;14:2703-11.
16. George DJ, Kaelin WG Jr. The von Hippel-Lindau protein, vascular endothelial growth factor, and kidney cancer. N Engl J Med 2003;349:419-21.
17. Elamin YY, Rafee S, Toomey S, Hennessy BT. Immune effects of bevacizumab: killing two birds with one stone. Cancer Microenviron 2015;8:15-21.
18. Kusmartsev S, Eruslanov E, Kübler H, et al. Oxidative stress regulates expression of VEGFR1 in myeloid cells: link to tumor-induced immune suppression in renal cell carcinoma. J Immunol 2008;181:346-53.
19. Roland CL, Dineen SP, Lynn KD, et al. Inhibition of vascular endothelial growth factor reduces angiogenesis and modulates immune cell infiltration of orthotopic breast cancer xenografts. Mol Cancer Ther 2009;8:1761-71.
20. Zizzari IG, Napoletano C, Botticelli A, et al. TK Inhibitor pazopanib primes DCs by downregulation of the β-catenin pathway. Cancer Immunol Res 2018;6:711-22.
21. Choueiri TK, Fishman MN, Escudier B, et al. Immunomodulatory activity of nivolumab in metastatic renal cell carcinoma. Clin Cancer Res 2016;22:5461-71.
22. McDermott DF, Huseni MA, Atkins MB, et al. Clinical activity and molecular correlates of response to atezolizumab alone or in combination with bevacizumab versus sunitinib in renal cell carcinoma. Nat Med 2018;24:749-57.
23. Motzer RJ, Robbins PB, Powles T, et al. Avelumab plus axitinib versus sunitinib in advanced renal cell carcinoma: biomarker analysis of the phase 3 JAVELIN renal 101 trial. Nat Med 2020;26:1733-41.
24. Motzer RJ, Choueiri TK, McDermott DF, et al. Biomarker analysis from checkMate 214: nivolumab plus ipilimumab versus sunitinib in renal cell carcinoma. J Immunother Cancer 2022;10:e004316.
25. Brauer MJ, Zhuang G, Schmidt M, et al. Identification and analysis of in vivo VEGF downstream markers link VEGF pathway activity with efficacy of anti-VEGF therapies. Clin Cancer Res 2013;19:3681-92.
26. Powles T, Nickles D, Van Allen E, et al. Immune biomarkers associated with clinical benefit from atezolizumab (MPDL3280a; anti-PD-L1) in advanced urothelial bladder cancer (UBC). J immunother Cancer 2015;3:83.
27. Zelenay S, van der Veen AG, Böttcher JP, et al. Cyclooxygenase-dependent tumor growth through evasion of immunity. Cell 2015;162:1257-70.
28. Motzer RJ, Banchereau R, Hamidi H, et al. Molecular subsets in renal cancer determine outcome to checkpoint and angiogenesis blockade. Cancer Cell 2020;38:803-817.e4.
29. Motzer RJ, Powles T, Atkins MB, et al. Final overall survival and molecular analysis in immotion151, a phase 3 trial comparing atezolizumab plus bevacizumab vs. sunitinib in patients with previously untreated metastatic renal cell carcinoma. JAMA Oncol 2022;8:275-80.
30. Mollica V, Di Nunno V, Gatto L, et al. Resistance to systemic agents in renal cell carcinoma predict and overcome genomic strategies adopted by tumor. Cancers 2019;11:830.
31. Gubin MM, Zhang X, Schuster H, et al. Checkpoint blockade cancer immunotherapy targets tumour-specific mutant antigens. Nature 2014;515:577-81.
32. Terry S, Engelsen AST, Buart S, Elsayed WS, Venkatesh GH, Chouaib S. Hypoxia-driven intratumor heterogeneity and immune evasion. Cancer Lett 2020;492:1-10.
33. Gordan JD, Lal P, Dondeti VR, et al. HIF-alpha effects on c-Myc distinguish two subtypes of sporadic VHL-deficient clear cell renal carcinoma. Cancer Cell 2008;14:435-46.
34. Wu CP, Hsieh CH, Wu YS. The emergence of drug transporter-mediated multidrug resistance to cancer chemotherapy. Mol Pharm 2011;8:1996-2011.
35. Krchniakova M, Skoda J, Neradil J, Chlapek P, Veselska R. Repurposing tyrosine kinase inhibitors to overcome multidrug resistance in cancer: a focus on transporters and lysosomal sequestration. Int J Mol Sci 2020;21:3157.
36. Zhang GN, Zhang YK, Wang YJ, et al. Modulating the function of ATP-binding cassette subfamily G member 2 (ABCG2) with inhibitor cabozantinib. Pharmacol Res 2017;119:89-98.
37. Minocha M, Khurana V, Qin B, Pal D, Mitra AK. Enhanced brain accumulation of pazopanib by modulating P-gp and Bcrp1 mediated efflux with canertinib or erlotinib. Int J Pharm 2012;436:127-34.
38. D’Cunha R, Bae S, Murry DJ, An G. TKI combination therapy: strategy to enhance dasatinib uptake by inhibiting Pgp- and BCRP-mediated efflux. Biopharm Drug Dispos 2016;37:397-408.
39. Ferrao P, Sincock P, Cole S, Ashman L. Intracellular P-gp contributes to functional drug efflux and resistance in acute myeloid leukaemia. Leuk Res 2001;25:395-405.
40. Molinari A, Calcabrini A, Meschini S, et al. Subcellular detection and localization of the drug transporter P-glycoprotein in cultured tumor cells. Curr Protein Pept Sci 2002;3:653-70.
41. Gotink KJ, Broxterman HJ, Labots M, et al. Lysosomal sequestration of sunitinib: a novel mechanism of drug resistance. Clin Cancer Res 2011;17:7337-46.
42. Gotink KJ, Rovithi M, de Haas RR, et al. Cross-resistance to clinically used tyrosine kinase inhibitors sunitinib, sorafenib and pazopanib. Cell Oncol 2015;38:119-29.
43. Zama IN, Hutson TE, Elson P, et al. Sunitinib rechallenge in metastatic renal cell carcinoma patients. Cancer 2010;116:5400-6.
44. Bergers G, Hanahan D. Modes of resistance to anti-angiogenic therapy. Nat Rev Cancer 2008;8:592-603.
45. Lamouille S, Xu J, Derynck R. Molecular mechanisms of epithelial-mesenchymal transition. Nat Rev Mol Cell Biol 2014;15:178-96.
46. Tam SY, Wu VWC, Law HKW. Hypoxia-Induced epithelial-mesenchymal transition in cancers: HIF-1α and beyond. Front Oncol 2020;10:486.
47. Yang MH, Wu MZ, Chiou SH, et al. Direct regulation of TWIST by HIF-1alpha promotes metastasis. Nat Cell Biol 2008;10:295-305.
48. Zhang W, Shi X, Peng Y, et al. HIF-1α promotes epithelial-mesenchymal transition and metastasis through direct regulation of ZEB1 in colorectal cancer. PLoS One 2015;10:e0129603.
49. Peinado H, Del Carmen Iglesias-de la Cruz M, Olmeda D, et al. A molecular role for lysyl oxidase-like 2 enzyme in snail regulation and tumor progression. EMBO J 2005;24:3446-58.
50. Lundgren K, Nordenskjöld B, Landberg G. Hypoxia, Snail and incomplete epithelial-mesenchymal transition in breast cancer. Br J Cancer 2009;101:1769-81.
51. Hapke RY, Haake SM. Hypoxia-induced epithelial to mesenchymal transition in cancer. Cancer Lett 2020;487:10-20.
52. Craene B, Berx G. Regulatory networks defining EMT during cancer initiation and progression. Nat Rev Cancer 2013;13:97-110.
53. Xu J, Lamouille S, Derynck R. TGF-beta-induced epithelial to mesenchymal transition. Cell Res 2009;19:156-72.
54. Huber MA, Azoitei N, Baumann B, et al. NF-kappaB is essential for epithelial-mesenchymal transition and metastasis in a model of breast cancer progression. J Clin Invest 2004;114:569-81.
55. Wang Z, Li Y, Kong D, Sarkar FH. The role of Notch signaling pathway in epithelial-mesenchymal transition (EMT) during development and tumor aggressiveness. Curr Drug Targets 2010;11:745-51.
56. Li H, Batth IS, Qu X, et al. IGF-IR signaling in epithelial to mesenchymal transition and targeting IGF-IR therapy: overview and new insights. Mol Cancer 2017;16:6.
57. Sharma R, Kadife E, Kannourakis G, Ahmed N, Prithviraj P. Targeting epithelial-mesenchymal transition (EMT), novel strategy to delay resistance or re-sensitize renal cancer to Sunitinib. Ann Oncol 2019;30:ix73.
58. Hwang HS, Go H, Park JM, et al. Epithelial-mesenchymal transition as a mechanism of resistance to tyrosine kinase inhibitors in clear cell renal cell carcinoma. Lab Invest 2019;99:659-70.
59. Bridgeman VL, Vermeulen PB, Foo S, et al. Vessel co-option is common in human lung metastases and mediates resistance to anti-angiogenic therapy in preclinical lung metastasis models. J Pathol 2017;241:362-74.
60. Yun YR, Won JE, Jeon E, et al. Fibroblast growth factors: biology, function, and application for tissue regeneration. J Tissue Eng 2010;2010:218142.
61. Welti JC, Gourlaouen M, Powles T, et al. Fibroblast growth factor 2 regulates endothelial cell sensitivity to sunitinib. Oncogene 2011;30:1183-93.
62. Casanovas O, Hicklin DJ, Bergers G, Hanahan D. Drug resistance by evasion of antiangiogenic targeting of VEGF signaling in late-stage pancreatic islet tumors. Cancer Cell 2005;8:299-309.
63. Fischer C, Jonckx B, Mazzone M, et al. Anti-PlGF inhibits growth of VEGF(R)-inhibitor-resistant tumors without affecting healthy vessels. Cell 2007;131:463-75.
64. Presta M, Dell’Era P, Mitola S, Moroni E, Ronca R, Rusnati M. Fibroblast growth factor/fibroblast growth factor receptor system in angiogenesis. Cytokine Growth Factor Rev 2005;16:159-78.
65. Birchmeier C, Birchmeier W, Gherardi E, Vande Woude GF. Met, metastasis, motility and more. Nat Rev Mol Cell Biol 2003;4:915-25.
66. Weidner KM, Di Cesare S, Sachs M, Brinkmann V, Behrens J, Birchmeier W. Interaction between Gab1 and the c-Met receptor tyrosine kinase is responsible for epithelial morphogenesis. Nature 1996;384:173-6.
67. Lai AZ, Abella JV, Park M. Crosstalk in Met receptor oncogenesis. Trends Cell Biol 2009;19:542-51.
68. Gherardi E, Birchmeier W, Birchmeier C, Vande Woude G. Targeting MET in cancer: rationale and progress. Nat Rev Cancer 2012;12:89-103.
69. Hara S, Nakashiro K, Klosek SK, Ishikawa T, Shintani S, Hamakawa H. Hypoxia enhances c-Met/HGF receptor expression and signaling by activating HIF-1alpha in human salivary gland cancer cells. Oral Oncol 2006;42:593-8.
70. Ide T, Kitajima Y, Miyoshi A, et al. Tumor-stromal cell interaction under hypoxia increases the invasiveness of pancreatic cancer cells through the hepatocyte growth factor/c-Met pathway. Int J Cancer 2006;119:2750-9.
71. Pennacchietti S, Michieli P, Galluzzo M, Mazzone M, Giordano S, Comoglio PM. Hypoxia promotes invasive growth by transcriptional activation of the met protooncogene. Cancer Cell 2003;3:347-61.
72. Scarpino S, Cancellario d’Alena F, Di Napoli A, Pasquini A, Marzullo A, Ruco LP. Increased expression of met protein is associated with up-regulation of hypoxia inducible factor-1 (HIF-1) in tumour cells in papillary carcinoma of the thyroid. J Pathol 2004;202:352-8.
73. Huang X, Li E, Shen H, et al. Targeting the HGF/MET axis in cancer therapy: challenges in resistance and opportunities for improvement. Front Cell Dev Biol 2020;8:152.
74. Glodde N, Bald T, van den Boorn-Konijnenberg D, et al. Reactive neutrophil responses dependent on the receptor tyrosine kinase c-MET limit cancer Immunotherapy. Immunity 2017;47:789-802.e9.
75. Sequist LV, Waltman BA, Dias-Santagata D, et al. Genotypic and histological evolution of lung cancers acquiring resistance to EGFR inhibitors. Sci Transl Med 2011;3:75ra26.
76. Ohashi K, Maruvka YE, Michor F, Pao W. Epidermal growth factor receptor tyrosine kinase inhibitor-resistant disease. J Clin Oncol 2013;31:1070-80.
77. Migliore C, Morando E, Ghiso E, et al. miR-205 mediates adaptive resistance to MET inhibition via ERRFI1 targeting and raised EGFR signaling. EMBO Mol Med 2018;10:e8746.
78. Hafizi S, Dahlbäck B. Signalling and functional diversity within the Axl subfamily of receptor tyrosine kinases. Cytokine Growth Factor Rev 2006;17:295-304.
79. Graham DK, DeRyckere D, Davies KD, Earp HS. The TAM family: phosphatidylserine sensing receptor tyrosine kinases gone awry in cancer. Nat Rev Cancer 2014;14:769-85.
80. Paccez JD, Vogelsang M, Parker MI, Zerbini LF. The receptor tyrosine kinase Axl in cancer: biological functions and therapeutic implications. Int J Cancer 2014;134:1024-33.
81. Hafizi S, Dahlbäck B. Gas6 and protein S. Vitamin K-dependent ligands for the Axl receptor tyrosine kinase subfamily. FEBS J 2006;273:5231-44.
83. Gustafsson A, Fritz HKM, Dahlbäck B. Gas6-Axl signaling in presence of sunitinib is enhanced, diversified and sustained in renal tumor cells, resulting in tumor-progressive advantages. Exp Cell Res 2017;355:47-56.
84. Scheller J, Chalaris A, Schmidt-Arras D, Rose-John S. The pro- and anti-inflammatory properties of the cytokine interleukin-6. Biochim Biophys Acta 2011;1813:878-88.
85. Russo RC, Garcia CC, Teixeira MM, Amaral FA. The CXCL8/IL-8 chemokine family and its receptors in inflammatory diseases. Expert Rev Clin Immunol 2014;10:593-619.
86. Pilskog M, Bostad L, Edelmann RJ, Akslen LA, Beisland C, Straume O. Tumour cell expression of interleukin 6 receptor α is associated with response rates in patients treated with sunitinib for metastatic clear cell renal cell carcinoma. J Pathol Clin Res 2018;4:114-23.
87. Ishibashi K, Haber T, Breuksch I, et al. Overriding TKI resistance of renal cell carcinoma by combination therapy with IL-6 receptor blockade. Oncotarget 2017;8:55230-45.
88. Huang D, Ding Y, Zhou M, et al. Interleukin-8 mediates resistance to antiangiogenic agent sunitinib in renal cell carcinoma. Cancer Res 2010;70:1063-71.
89. Martin D, Galisteo R, Gutkind JS. CXCL8/IL8 stimulates vascular endothelial growth factor (VEGF) expression and the autocrine activation of VEGFR2 in endothelial cells by activating NFkappaB through the CBM (Carma3/Bcl10/Malt1) complex. J Biol Chem 2009;284:6038-42.
90. Tie Y, Tang F, Wei YQ, Wei XW. Immunosuppressive cells in cancer: mechanisms and potential therapeutic targets. J Hematol Oncol 2022;15:61.
91. Gabrilovich D. Mechanisms and functional significance of tumour-induced dendritic-cell defects. Nat Rev Immunol 2004;4:941-52.
92. Gabrilovich DI, Chen HL, Girgis KR, et al. Production of vascular endothelial growth factor by human tumors inhibits the functional maturation of dendritic cells. Nat Med 1996;2:1096-103.
93. Marigo I, Dolcetti L, Serafini P, Zanovello P, Bronte V. Tumor-induced tolerance and immune suppression by myeloid derived suppressor cells. Immunol Rev 2008;222:162-79.
94. Talmadge JE. Pathways mediating the expansion and immunosuppressive activity of myeloid-derived suppressor cells and their relevance to cancer therapy. Clin Cancer Res 2007;13:5243-8.
95. Ko JS, Rayman P, Ireland J, et al. Direct and differential suppression of myeloid-derived suppressor cell subsets by sunitinib is compartmentally constrained. Cancer Res 2010;70:3526-36.
96. Finke J, Ko J, Rini B, Rayman P, Ireland J, Cohen P. MDSC as a mechanism of tumor escape from sunitinib mediated anti-angiogenic therapy. Int Immunopharmacol 2011;11:856-61.
97. Diaz-Montero CM, Mao FJ, Barnard J, et al. MEK inhibition abrogates sunitinib resistance in a renal cell carcinoma patient-derived xenograft model. Br J Cancer 2016;115:920-8.
98. Ambrosetti D, Coutts M, Paoli C, et al. Cancer-associated fibroblasts in renal cell carcinoma: implication in prognosis and resistance to anti-angiogenic therapy. BJU Int 2022;129:80-92.
99. Liu J, Geng X, Hou J, Wu G. New insights into M1/M2 macrophages: key modulators in cancer progression. Cancer Cell Int 2021;21:389.
100. He Z, Zhang S. Tumor-associated macrophages and their functional transformation in the hypoxic tumor microenvironment. Front Immunol 2021;12:741305.
101. Hakimi AA, Voss MH, Kuo F, et al. Transcriptomic profiling of the tumor microenvironment reveals distinct subgroups of clear cell renal cell cancer: data from a randomized phase III trial. Cancer Discov 2019;9:510-25.
102. Nakano O, Sato M, Naito Y, et al. Proliferative activity of intratumoral CD8(+) T-lymphocytes as a prognostic factor in human renal cell carcinoma: clinicopathologic demonstration of antitumor immunity. Cancer Res 2001;61:5132-6.
103. Liu XD, Hoang A, Zhou L, et al. Resistance to antiangiogenic therapy is associated with an immunosuppressive tumor microenvironment in metastatic renal cell carcinoma. Cancer Immunol Res 2015;3:1017-29.
104. Park KY, Hefti HO, Liu P, Lugo-Cintrón KM, Kerr SC, Beebe DJ. Immune cell mediated cabozantinib resistance for patients with renal cell carcinoma. Integr Biol 2021;13:259-68.
105. He L, Hannon GJ. MicroRNAs: small RNAs with a big role in gene regulation. Nat Rev Genet 2004;5:522-31.
106. Chou CH, Chang NW, Shrestha S, et al. miRTarBase 2016: updates to the experimentally validated miRNA-target interactions database. Nucleic Acids Res 2016;44:D239-47.
107. Yamaguchi N, Osaki M, Onuma K, et al. Identification of microRNAs involved in resistance to sunitinib in renal cell carcinoma cells. Anticancer Res 2017;37:2985-92.
108. Sharma R, Kadife E, Myers M, Kannourakis G, Prithviraj P, Ahmed N. Determinants of resistance to VEGF-TKI and immune checkpoint inhibitors in metastatic renal cell carcinoma. J Exp Clin Cancer Res 2021;40:186.
109. Marshall JS, Warrington R, Watson W, Kim HL. An introduction to immunology and immunopathology. Allergy Asthma Clin Immunol 2018;14:49.
110. Sharma P, Hu-Lieskovan S, Wargo JA, Ribas A. Primary, adaptive, and acquired resistance to cancer immunotherapy. Cell 2017;168:707-23.
111. de Velasco G, Miao D, Voss MH, et al. Tumor mutational load and immune parameters across metastatic renal cell carcinoma risk groups. Cancer Immunol Res 2016;4:820-2.
112. Wang C, Wang Z, Yao T, Zhou J, Wang Z. The immune-related role of beta-2-microglobulin in melanoma. Front Oncol 2022;12:944722.
113. Veglia F, Gabrilovich DI. Dendritic cells in cancer: the role revisited. Curr Opin Immunol 2017;45:43-51.
114. Spranger S, Bao R, Gajewski TF. Melanoma-intrinsic β-catenin signalling prevents anti-tumour immunity. Nature 2015;523:231-5.
115. Posso-Osorio I, Tobón GJ, Cañas CA. Human endogenous retroviruses (HERV) and non-HERV viruses incorporated into the human genome and their role in the development of autoimmune diseases. J Transl Autoimmun 2021;4:100137.
116. Smith CC, Beckermann KE, Bortone DS, et al. Endogenous retroviral signatures predict immunotherapy response in clear cell renal cell carcinoma. J Clin Invest 2018;128:4804-20.
117. Peng W, Chen JQ, Liu C, et al. Loss of PTEN promotes resistance to T cell-mediated immunotherapy. Cancer Discov 2016;6:202-16.
118. Shin DS, Zaretsky JM, Escuin-Ordinas H, et al. Primary resistance to PD-1 blockade mediated by JAK1/2 mutations. Cancer Discov 2017;7:188-201.
119. Lin E, Liu X, Liu Y, et al. Roles of the dynamic tumor immune microenvironment in the individualized treatment of advanced clear cell renal cell carcinoma. Front Immunol 2021;12:653358.
120. Komohara Y, Hasita H, Ohnishi K, et al. Macrophage infiltration and its prognostic relevance in clear cell renal cell carcinoma. Cancer Sci 2011;102:1424-31.
121. Kaneda MM, Messer KS, Ralainirina N, et al. PI3Kγ is a molecular switch that controls immune suppression. Nature 2016;539:437-42.
122. Togashi Y, Shitara K, Nishikawa H. Regulatory T cells in cancer immunosuppression - implications for anticancer therapy. Nat Rev Clin Oncol 2019;16:356-71.
123. Serrels A, Lund T, Serrels B, et al. Nuclear FAK controls chemokine transcription, tregs, and evasion of anti-tumor immunity. Cell 2015;163:160-73.
124. Togashi Y, Kamada T, Sasaki A, et al. Clinicopathological, genomic and immunological features of hyperprogressive disease during PD-1 blockade in gastric cancer patients. J Clin Oncol 2018;36:4106-4106.
125. Lowther DE, Goods BA, Lucca LE, et al. PD-1 marks dysfunctional regulatory T cells in malignant gliomas. JCI Insight 2016;1:e85935.
126. John P, Pulanco MC, Galbo PM Jr, et al. The immune checkpoint B7x expands tumor-infiltrating Tregs and promotes resistance to anti-CTLA-4 therapy. Nat Commun 2022;13:2506.
127. Weber R, Fleming V, Hu X, et al. Myeloid-derived suppressor cells hinder the anti-cancer activity of immune checkpoint inhibitors. Front Immunol 2018;9:1310.
128. Norian LA, Rodriguez PC, O’Mara LA, et al. Tumor-infiltrating regulatory dendritic cells inhibit CD8+ T cell function via L-arginine metabolism. Cancer Res 2009;69:3086-94.
129. Liu Q, Zhang C, Sun A, Zheng Y, Wang L, Cao X. Tumor-educated CD11bhighIalow regulatory dendritic cells suppress T cell response through arginase I. J Immunol 2009;182:6207-16.
130. Beuselinck B, Job S, Becht E, et al. Molecular subtypes of clear cell renal cell carcinoma are associated with sunitinib response in the metastatic setting. Clin Cancer Res 2015;21:1329-39.
131. Vano YA, Elaidi R, Bennamoun M, et al. Nivolumab, nivolumab-ipilimumab, and VEGFR-tyrosine kinase inhibitors as first-line treatment for metastatic clear-cell renal cell carcinoma (BIONIKK): a biomarker-driven, open-label, non-comparative, randomised, phase 2 trial. Lancet Oncol 2022;23:612-24.
132. Piva F, Santoni M, Matrana MR, et al. BAP1, PBRM1 and SETD2 in clear-cell renal cell carcinoma: molecular diagnostics and possible targets for personalized therapies. Expert Rev Mol Diagn 2015;15:1201-10.
133. Hakimi AA, Chen YB, Wren J, et al. Clinical and pathologic impact of select chromatin-modulating tumor suppressors in clear cell renal cell carcinoma. Eur Urol 2013;63:848-54.
134. Peña-Llopis S, Christie A, Xie XJ, Brugarolas J. Cooperation and antagonism among cancer genes: the renal cancer paradigm. Cancer Res 2013;73:4173-9.
135. Miao D, Margolis CA, Gao W, et al. Genomic correlates of response to immune checkpoint therapies in clear cell renal cell carcinoma. Science 2018;359:801-6.
136. Wang T, Lu R, Kapur P, et al. An empirical approach leveraging tumorgrafts to dissect the tumor microenvironment in renal cell carcinoma identifies missing link to prognostic inflammatory factors. Cancer Discov 2018;8:1142-55.
137. Kroemer G, Zitvogel L. Cancer immunotherapy in 2017: The breakthrough of the microbiota. Nat Rev Immunol 2018;18:87-8.
138. Routy B, Le Chatelier E, Derosa L, et al. Gut microbiome influences efficacy of PD-1-based immunotherapy against epithelial tumors. Science 2018;359:91-7.
139. Derosa L, Hellmann MD, Spaziano M, et al. Negative association of antibiotics on clinical activity of immune checkpoint inhibitors in patients with advanced renal cell and non-small-cell lung cancer. Ann Oncol 2018;29:1437-44.
140. Elkrief A, El Raichani L, Richard C, et al. Antibiotics are associated with decreased progression-free survival of advanced melanoma patients treated with immune checkpoint inhibitors. Oncoimmunology 2019;8:e1568812.
141. Derosa L, Routy B, Fidelle M, et al. Gut bacteria composition drives primary resistance to cancer immunotherapy in renal cell carcinoma patients. Eur Urol 2020;78:195-206.
142. Zaretsky JM, Garcia-Diaz A, Shin DS, et al. mutations associated with acquired resistance to PD-1 blockade in melanoma. N Engl J Med 2016;375:819-29.
143. Schrörs B, Lübcke S, Lennerz V, et al. HLA class I loss in metachronous metastases prevents continuous T cell recognition of mutated neoantigens in a human melanoma model. Oncotarget 2017;8:28312-27.
144. Romero I, Garrido C, Algarra I, et al. MHC intratumoral heterogeneity may predict cancer progression and response to immunotherapy. Front Immunol 2018;9:102.
145. del Campo AB, Kyte JA, Carretero J, et al. Immune escape of cancer cells with beta2-microglobulin loss over the course of metastatic melanoma. Int J Cancer 2014;134:102-13.
146. Bernal M, Ruiz-Cabello F, Concha A, Paschen A, Garrido F. Implication of the β2-microglobulin gene in the generation of tumor escape phenotypes. Cancer Immunol Immunother 2012;61:1359-71.
147. Park HJ, Park JS, Jeong YH, et al. PD-1 upregulated on regulatory T cells during chronic virus infection enhances the suppression of CD8+ T cell immune response via the interaction with PD-L1 expressed on CD8+ T cells. J Immunol 2015;194:5801-11.
148. Jin HT, Anderson AC, Tan WG, et al. Cooperation of Tim-3 and PD-1 in CD8 T-cell exhaustion during chronic viral infection. Proc Natl Acad Sci U S A 2010;107:14733-8.
149. Ahmadzadeh M, Johnson LA, Heemskerk B, et al. Tumor antigen-specific CD8 T cells infiltrating the tumor express high levels of PD-1 and are functionally impaired. Blood 2009;114:1537-44.
150. Kumagai S, Togashi Y, Kamada T, et al. The PD-1 expression balance between effector and regulatory T cells predicts the clinical efficacy of PD-1 blockade therapies. Nat Immunol 2020;21:1346-58.
151. Mori K, Abufaraj M, Mostafaei H, et al. The predictive value of programmed death ligand 1 in patients with metastatic renal cell carcinoma treated with immune-checkpoint inhibitors: a systematic review and meta-analysis. Eur Urol 2021;79:783-92.
152. Andrews LP, Marciscano AE, Drake CG, Vignali DA. LAG3 (CD223) as a cancer immunotherapy target. Immunol Rev 2017;276:80-96.
153. Donia M, Andersen R, Kjeldsen JW, et al. Aberrant expression of MHC class II in melanoma attracts inflammatory tumor-specific CD4+ T- Cells, which dampen CD8+ T-cell antitumor reactivity. Cancer Res 2015;75:3747-59.
154. Kouo T, Huang L, Pucsek AB, et al. Galectin-3 shapes antitumor immune responses by suppressing CD8+ T cells via LAG-3 and inhibiting expansion of plasmacytoid dendritic cells. Cancer Immunol Res 2015;3:412-23.
155. Xu F, Liu J, Liu D, et al. LSECtin expressed on melanoma cells promotes tumor progression by inhibiting antitumor T-cell responses. Cancer Res 2014;74:3418-28.
156. Zelba H, Bedke J, Hennenlotter J, et al. PD-1 and LAG-3 dominate checkpoint receptor-mediated T-cell inhibition in renal cell carcinoma. Cancer Immunol Res 2019;7:1891-9.
157. Das M, Zhu C, Kuchroo VK. Tim-3 and its role in regulating anti-tumor immunity. Immunol Rev 2017;276:97-111.
158. Zhu C, Anderson AC, Schubart A, et al. The Tim-3 ligand galectin-9 negatively regulates T helper type 1 immunity. Nat Immunol 2005;6:1245-52.
159. Huang YH, Zhu C, Kondo Y, et al. CEACAM1 regulates TIM-3-mediated tolerance and exhaustion. Nature 2015;517:386-90.
160. Prokhorov A, Gibbs BF, Bardelli M, et al. The immune receptor Tim-3 mediates activation of PI3 kinase/mTOR and HIF-1 pathways in human myeloid leukaemia cells. Int J Biochem Cell Biol 2015;59:11-20.
161. Wang JM, Ma CJ, Li GY, et al. Tim-3 alters the balance of IL-12/IL-23 and drives TH17 cells: role in hepatitis B vaccine failure during hepatitis C infection. Vaccine 2013;31:2238-45.
162. Wang JM, Shi L, Ma CJ, et al. Differential regulation of interleukin-12 (IL-12)/IL-23 by Tim-3 drives T(H)17 cell development during hepatitis C virus infection. J Virol 2013;87:4372-83.
163. Ma CJ, Li GY, Cheng YQ, et al. Cis association of galectin-9 with Tim-3 differentially regulates IL-12/IL-23 expressions in monocytes via TLR signaling. PLoS One 2013;8:e72488.
164. Dardalhon V, Anderson AC, Karman J, et al. Tim-3/galectin-9 pathway: regulation of Th1 immunity through promotion of CD11b+Ly-6G+ myeloid cells. J Immunol 2010;185:1383-92.
165. Sakuishi K, Ngiow SF, Sullivan JM, et al. TIM3+FOXP3+ regulatory T cells are tissue-specific promoters of T-cell dysfunction in cancer. Oncoimmunology 2013;2:e23849.
166. Sakuishi K, Apetoh L, Sullivan JM, Blazar BR, Kuchroo VK, Anderson AC. Targeting Tim-3 and PD-1 pathways to reverse T cell exhaustion and restore anti-tumor immunity. J Exp Med 2010;207:2187-94.
167. Mohsenzadegan M, Nowroozi MR, Fotovvat A, et al. The prospect of targeting T cell immunoglobulin and mucin-domain containing-3 in renal cell carcinoma immunotherapy. Scand J Immunol 2022;96:e13197.
168. Pignon JC, Jegede O, Shukla SA, et al. irRECIST for the evaluation of candidate biomarkers of response to nivolumab in metastatic clear cell renal cell carcinoma: analysis of a phase II prospective clinical trial. Clin Cancer Res 2019;25:2174-84.
169. Mitchell TJ, Turajlic S, Rowan A, et al. Timing the landmark events in the evolution of clear cell renal cell cancer: TRACERx renal. Cell 2018;173:611-23.e17.
170. Turajlic S, Xu H, Litchfield K, et al. Tracking cancer evolution reveals constrained routes to metastases: TRACERx renal. Cell 2018;173:581-94.e12.
171. Kowalewski A, Zdrenka M, Grzanka D, Szylberg Ł. Targeting the deterministic evolutionary trajectories of clear cell renal cell carcinoma. Cancers 2020;12:3300.
Cite This Article
Export citation file: BibTeX | RIS
OAE Style
Astore S, Baciarello G, Cerbone L, Calabrò F. Primary and acquired resistance to first-line therapy for clear cell renal cell carcinoma. Cancer Drug Resist 2023;6:517-46. http://dx.doi.org/10.20517/cdr.2023.33
AMA Style
Astore S, Baciarello G, Cerbone L, Calabrò F. Primary and acquired resistance to first-line therapy for clear cell renal cell carcinoma. Cancer Drug Resistance. 2023; 6(3): 517-46. http://dx.doi.org/10.20517/cdr.2023.33
Chicago/Turabian Style
Astore, Serena, Giulia Baciarello, Linda Cerbone, Fabio Calabrò. 2023. "Primary and acquired resistance to first-line therapy for clear cell renal cell carcinoma" Cancer Drug Resistance. 6, no.3: 517-46. http://dx.doi.org/10.20517/cdr.2023.33
ACS Style
Astore, S.; Baciarello G.; Cerbone L.; Calabrò F. Primary and acquired resistance to first-line therapy for clear cell renal cell carcinoma. Cancer Drug Resist. 2023, 6, 517-46. http://dx.doi.org/10.20517/cdr.2023.33
About This Article
Special Issue
Copyright

Data & Comments
Data


 Cite This Article 9 clicks

 Like This Article 4
likes
Like This Article 4
likes


Comments
Comments must be written in English. Spam, offensive content, impersonation, and private information will not be permitted. If any comment is reported and identified as inappropriate content by OAE staff, the comment will be removed without notice. If you have any queries or need any help, please contact us at support@oaepublish.com.